Version 1.0.17
This Visual Studio Code extension provides a rich editor for SDFGs with included profiling and debugging, static analysis, and interactive optimization.
Features
SDFG Editor
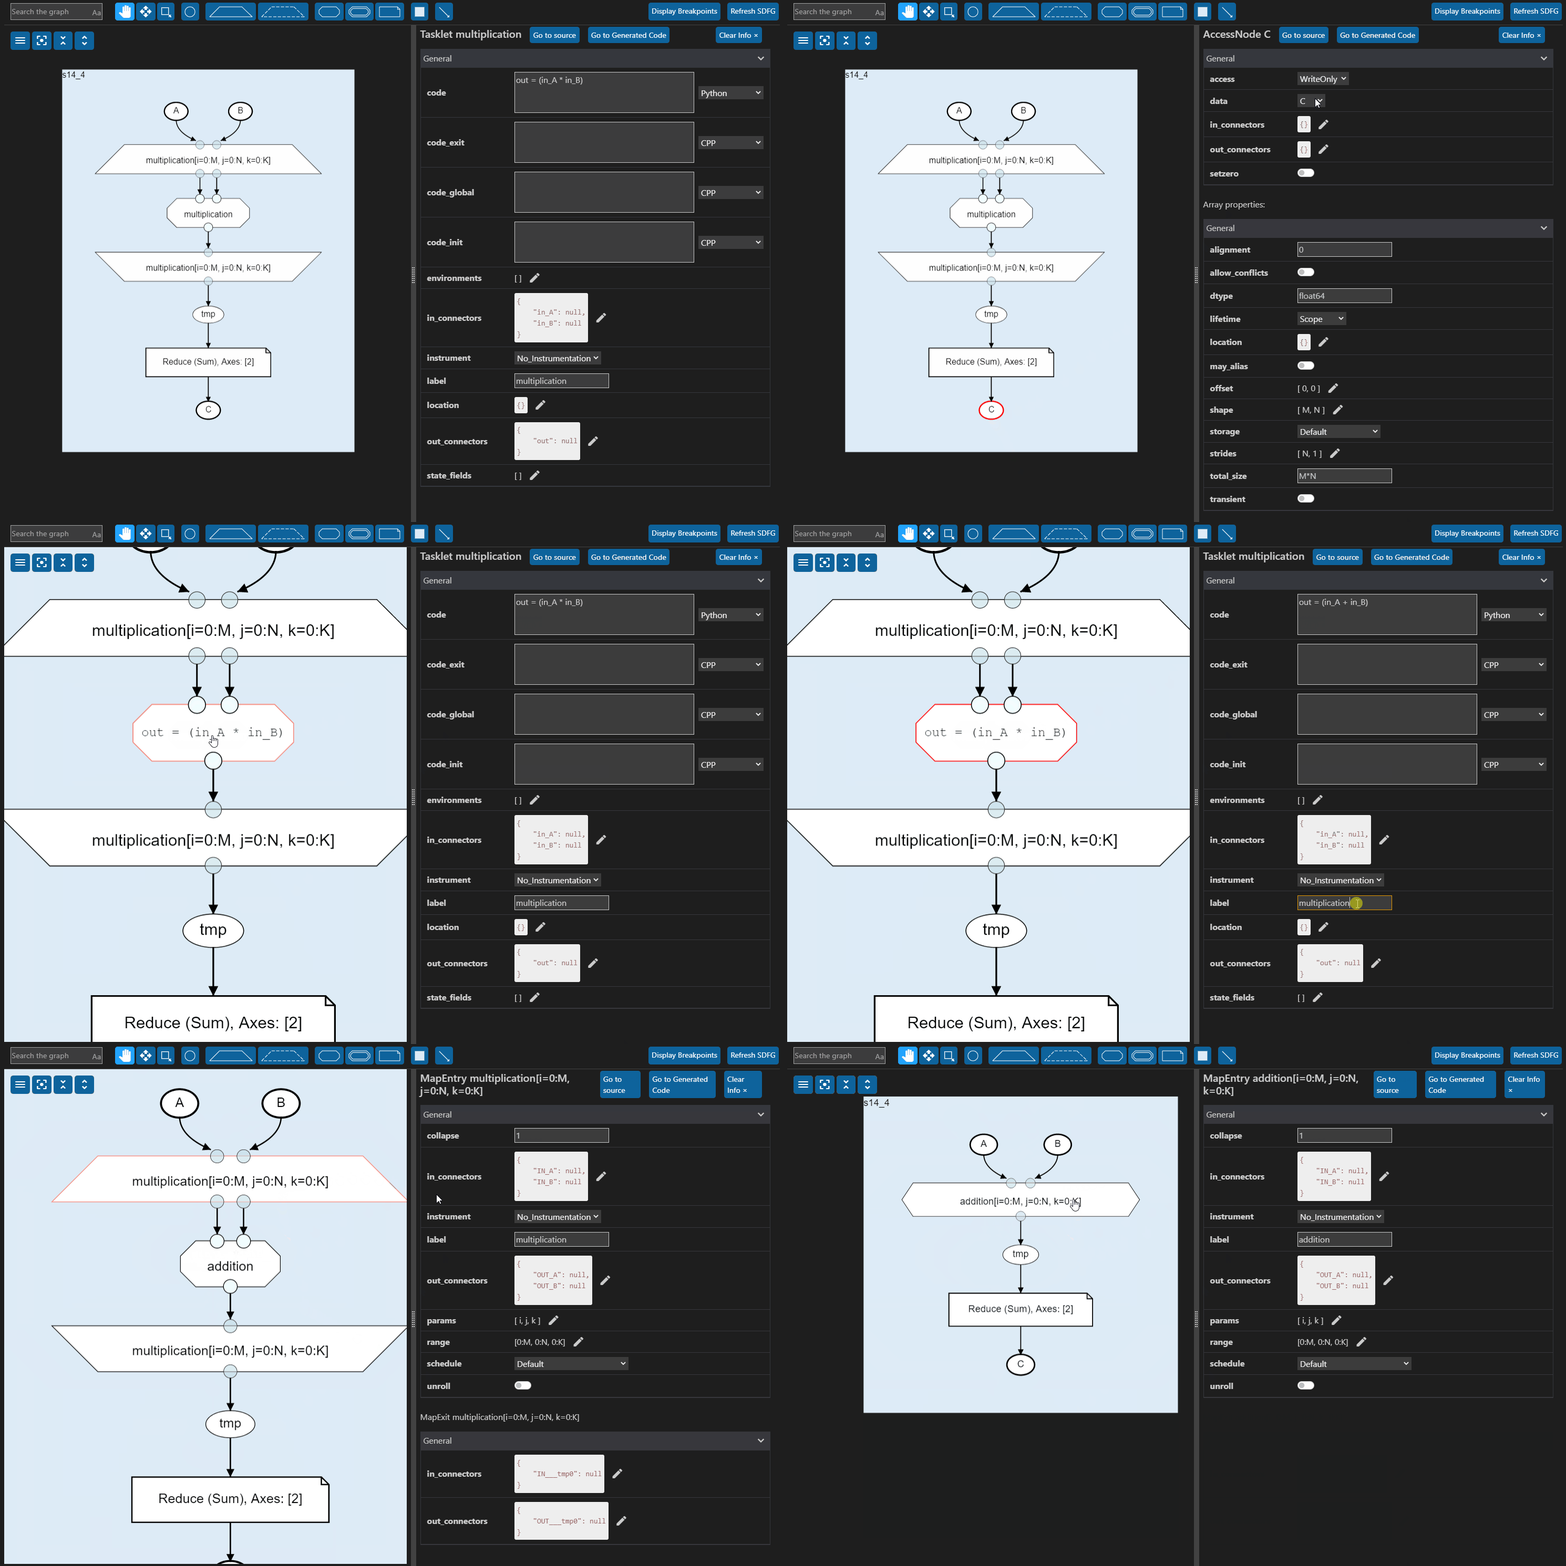
The SDFG editor allows changing of all editable SDFG properties and elements. To allow for easier exploration of large graphs, most graph elements can be collapsed into a smaller, more compact representation. A number of viewing options, like the hiding of access nodes, can further assist with the editing of larger graphs.
SDFG Optimization / Transformations
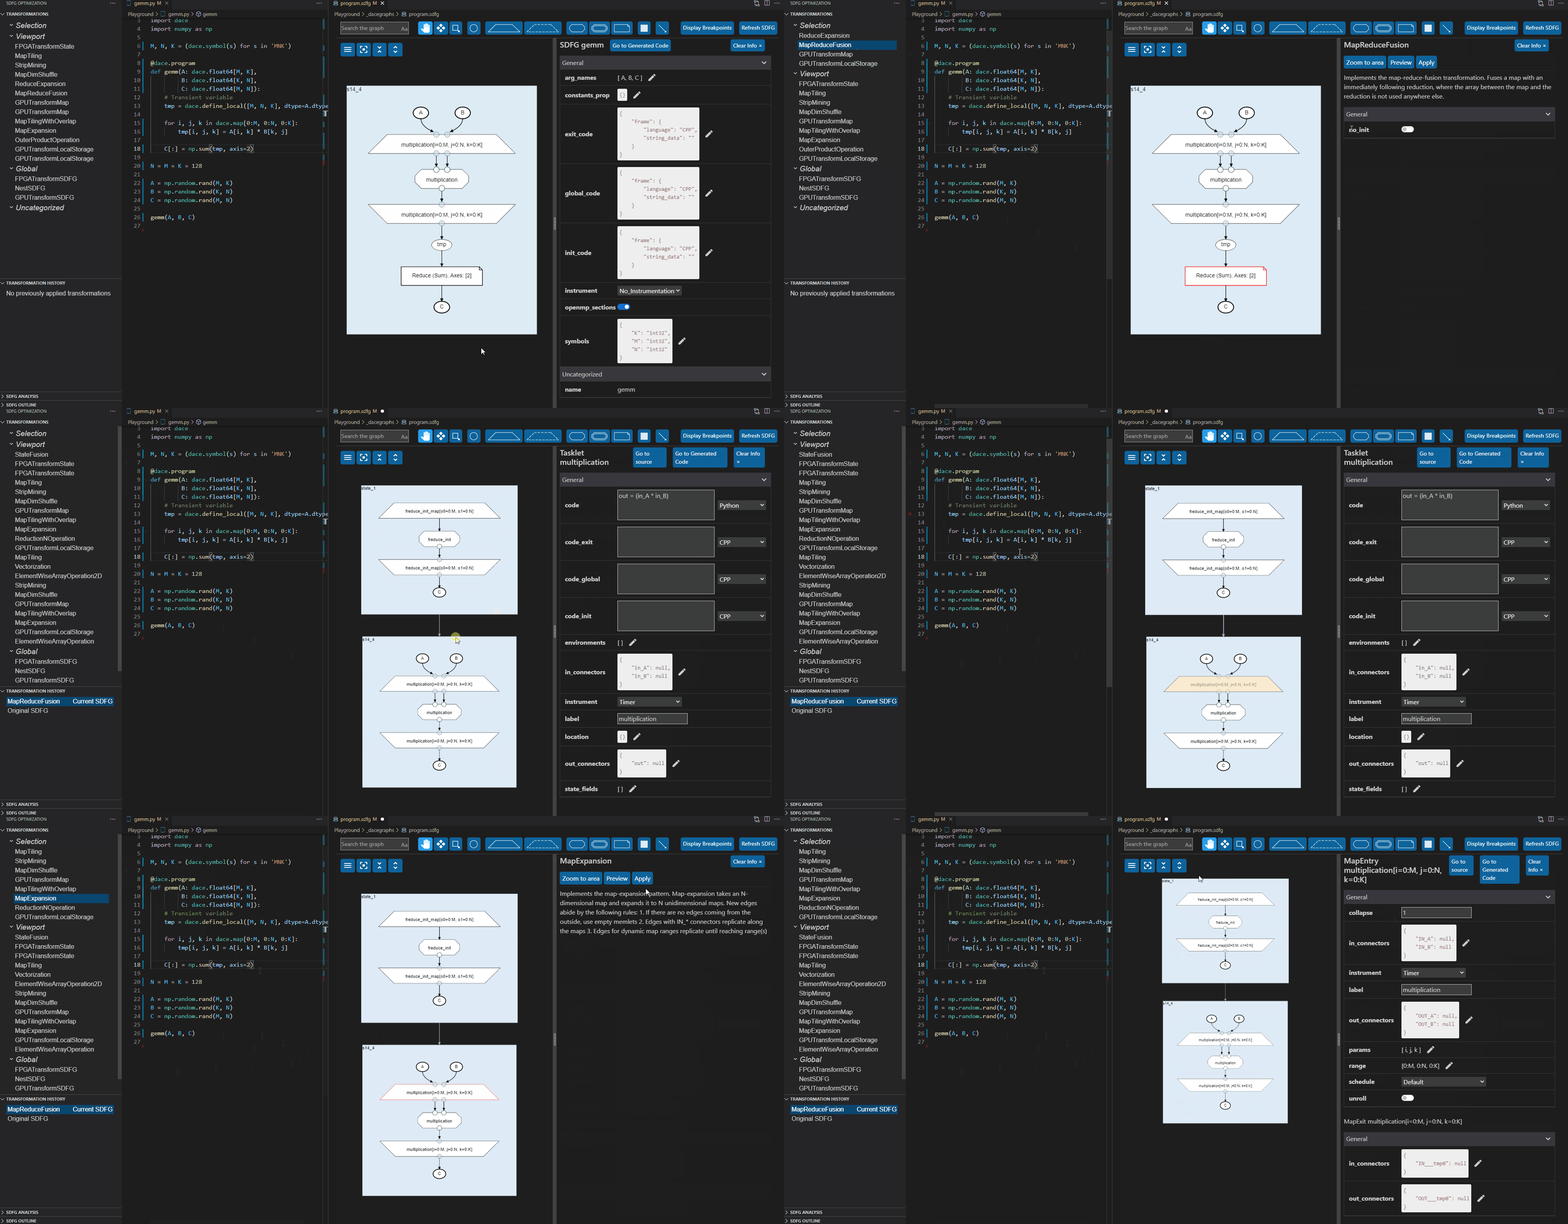
With the SDFG Editor, data-centric applications can be optimized interactively using transformations.
- A set of applicable performance optimizing transformations is shown in a sorted list in the side panel for each valid SDFG program.
- A description provides more information about each transformation.
- Transformations can be previewed before applying them to the SDFG.
- The transformation history allows easy undoing/redoing of specific optimization steps.
Static Analysis
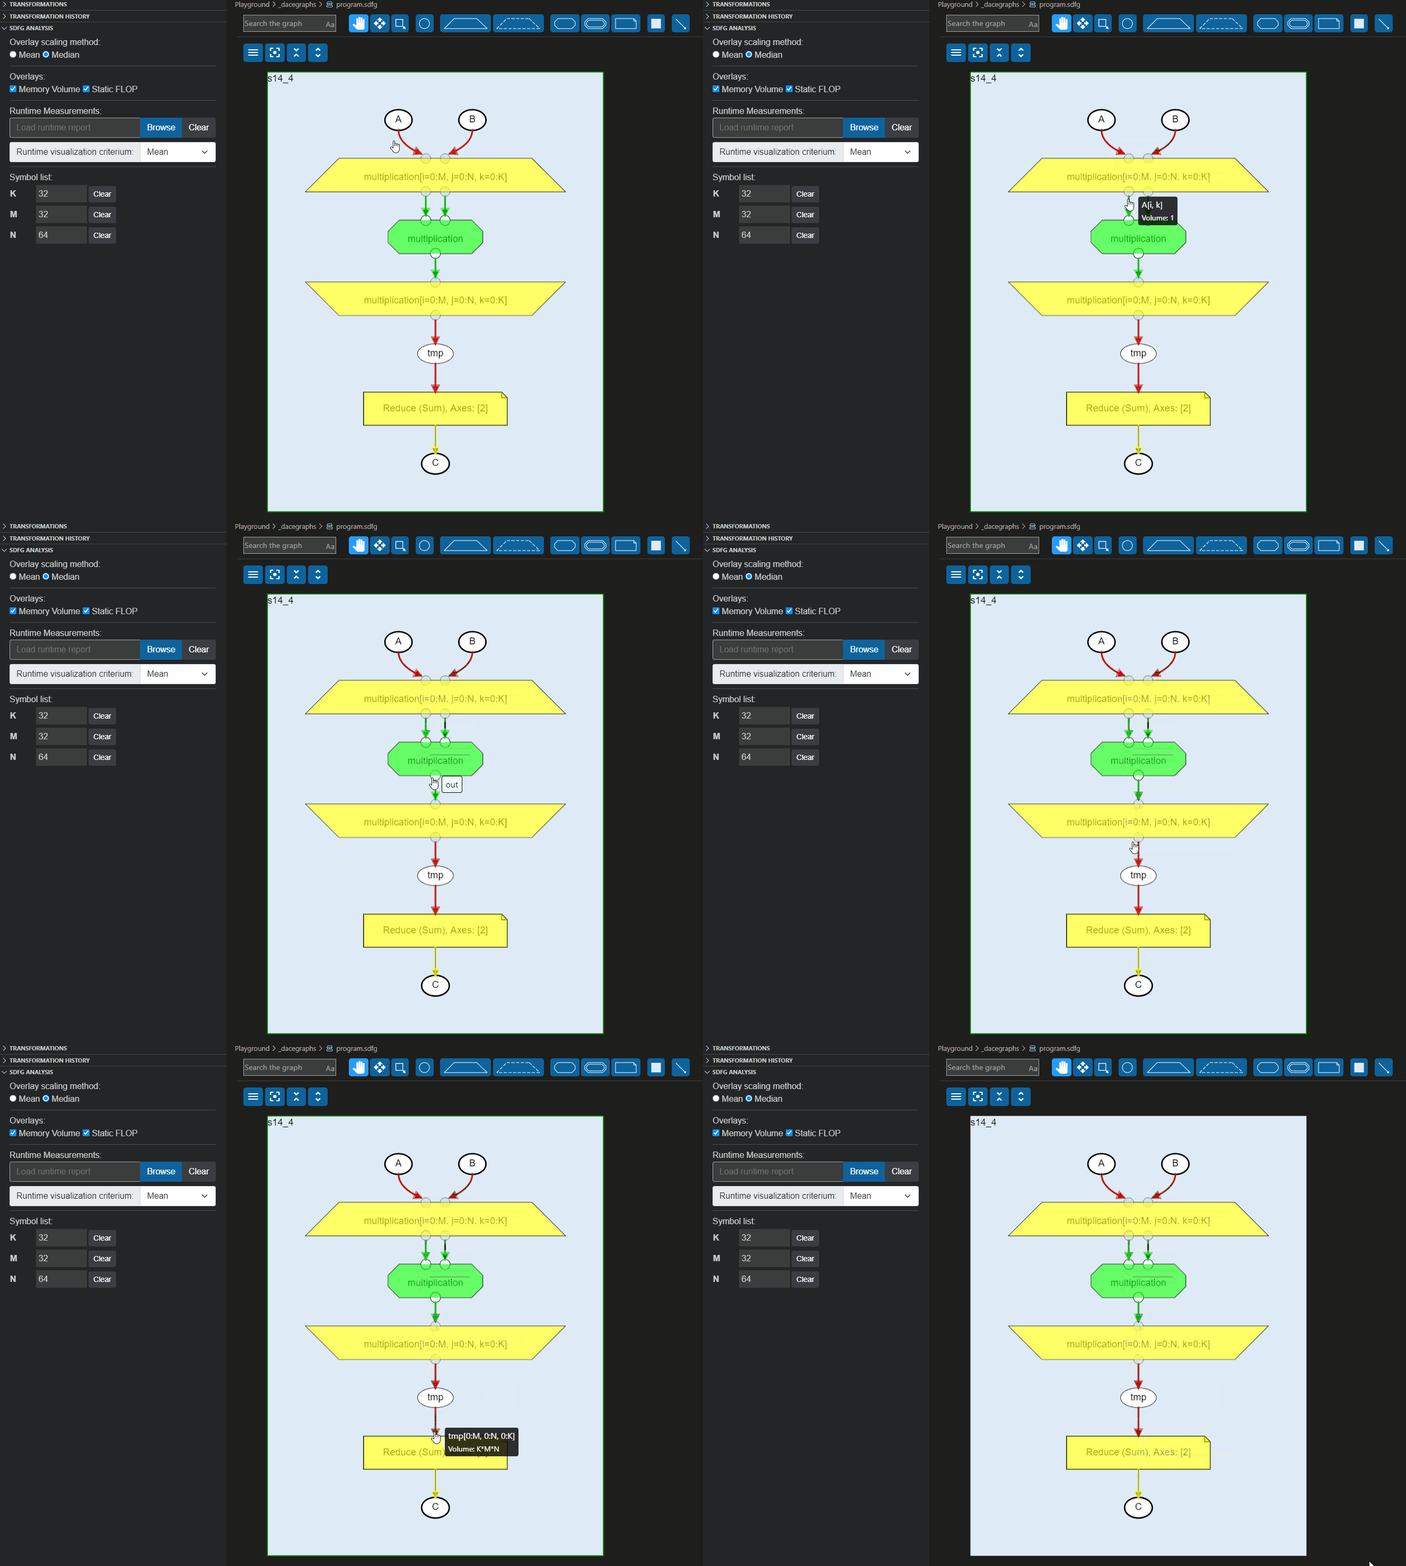
SDFGs can be statically analyzed for memory or compute bottlenecks using a series of overlays, which highlight the number of arithmetic operations or the amount of memory moved per graph element.
Profiling
A built-in profiling run configuration allows SDFG programs to be run multiple times1 while recording the median runtime for each execution. This median runtime is then reported back to you. Additionally, individual graph elements can be instrumented with timers, which generates a detailed profiling report after an SDFG's execution. This report can be loaded in an displayed via overlay on top of the SDFG.
1 The number of executions per profiling run can be configured in the .dace.config. This can be opened by typing Open .dace.config into the command bar.
Building SDFGs
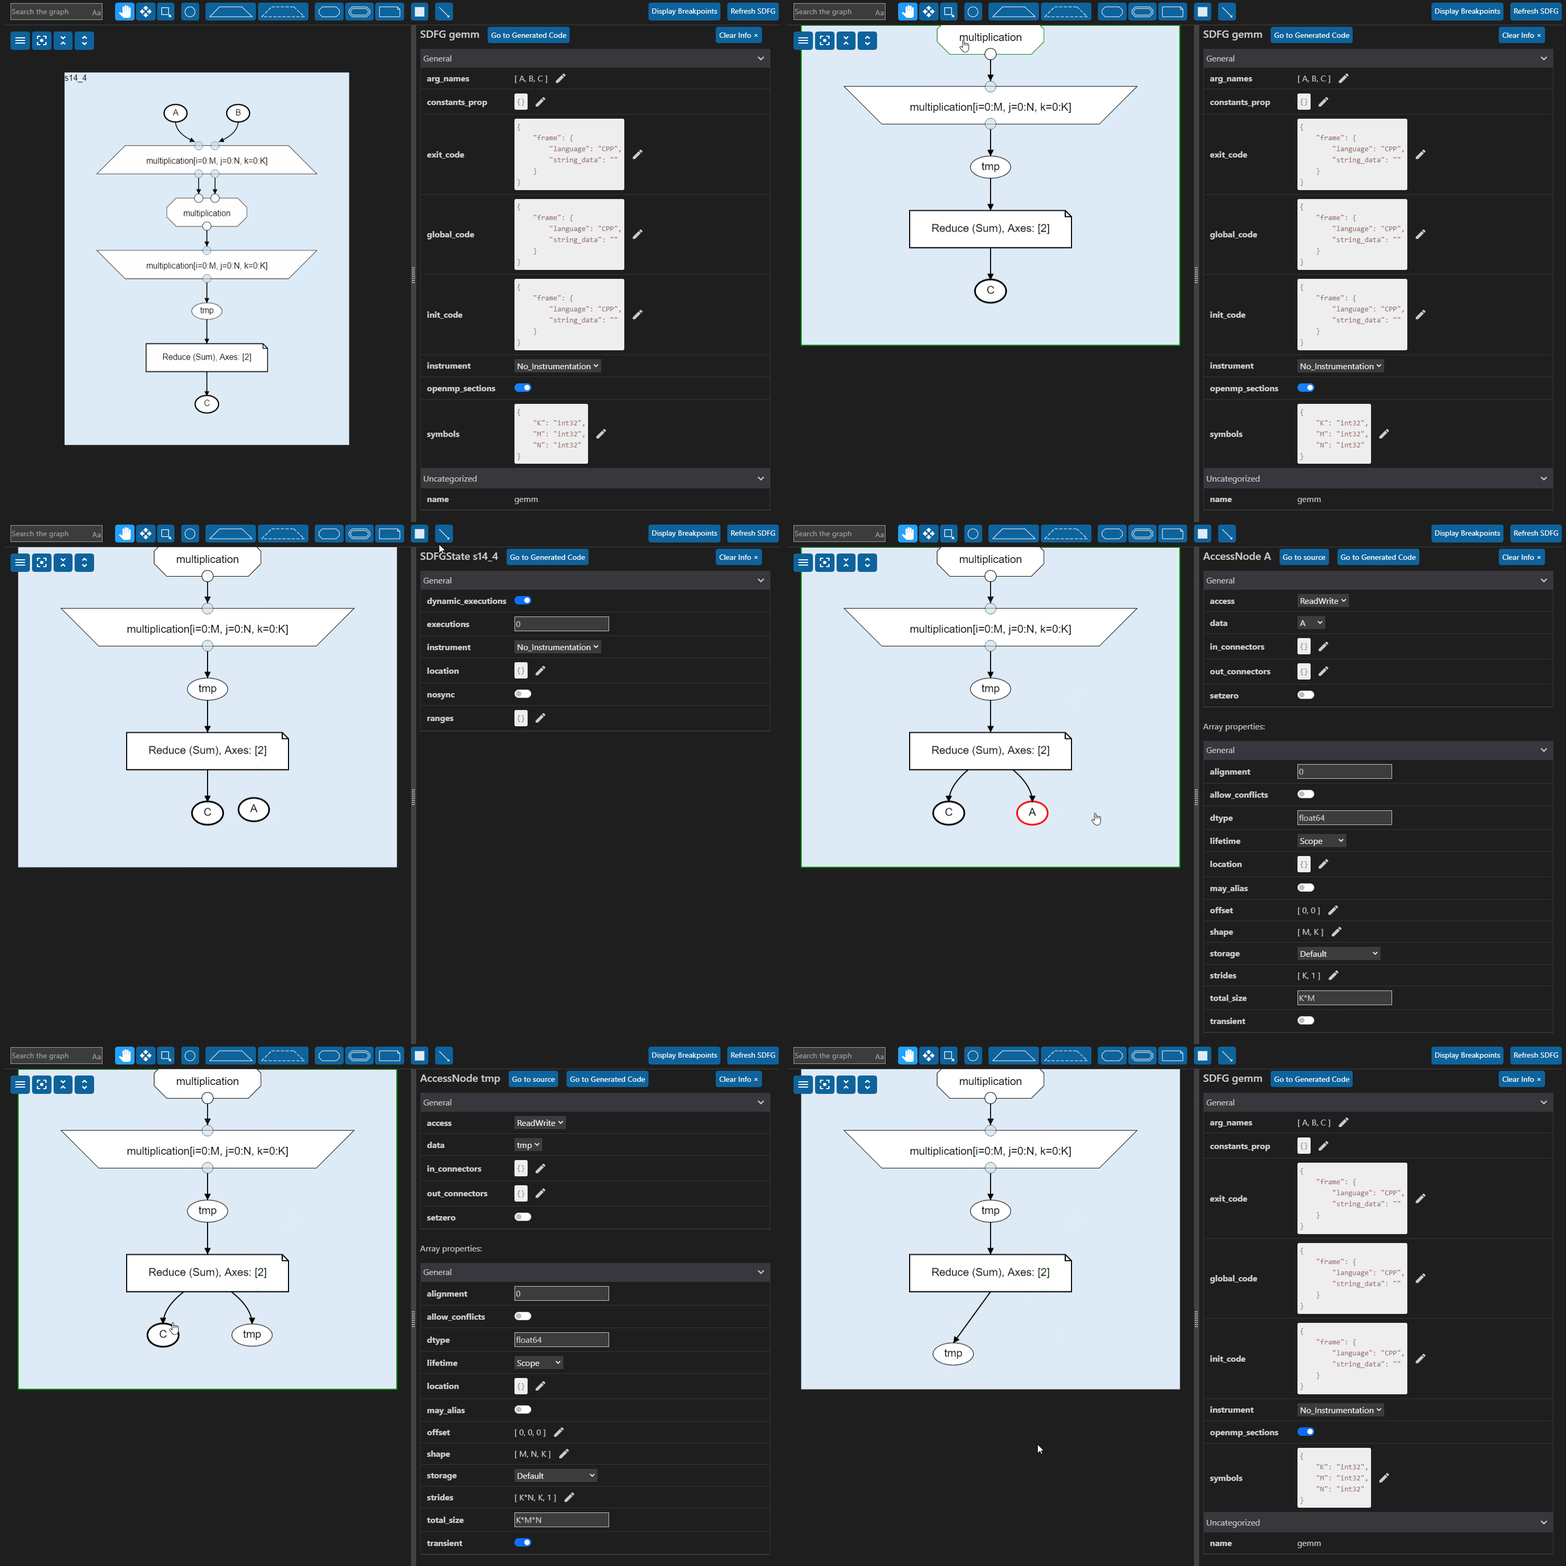
Graph elements can be dynamically added and moved around, allowing the creation of entire SDFGs from scratch.
Debugging
SDFGs can be run with a debugger, allowing the setting of breakpoints on the graph. For this purpose, the extension will install the Python / C++ Debugger extension.


