In Stock Market Prediction, our aim is to build an efficient Machine Learning model to predict the future value of the financial stocks of a company.Our machine learning model will be presented to retail investors with a third-party web app with the help of Streamlit. Along with predicting the future values of stocks, we will provide features like fundamental information of the company, technical indicators, technical screeners and pattern recognition.
- Tech Stack
- Objective
- Data source
- Steps
- Model Comparison
- Metrics
- Creating a webapp
- Lessons Learned and Recommendation
- Limitations
- Future Scope
- Explore the Notebook
- Demo
- Run Locally
- Explore the notebook
- License
-
Language : Python
  Machine Learning Package : Scikit-learn, Pandas, Numpy, Tensorflow, Keras

  Data Visualisation Package : Matplotlib, Plotly

  Technical Indicators Package : FinTA, TALib

  To garb OHLC data : yfinance
Note: All this are Python packages.
In Stock Market Prediction, our aim is to build an efficient Machine Learning model to predict the future value of the financial stocks of a company. The recent trend in stock market prediction technologies is the use of machine learning which makes predictions based on the values of current stock market indices by training on their previous values. Our project focuses on the use of Regression models and LSTM model to predict stock values. Factors considered are open, close, low, high and volume. Data will be taken from YAHOO FINANCE in the .csv format and as for the data cleaning and handling missing values, we will use Pandas and NumPy. Data visualization will be done with matplotlib and seaborn. Machine Learning modeling will be done with scikit-learn and Deep Learning with TensorFlow/Keras. Our machine learning model will be presented to retail investors with a third-party web app with the help of Streamlit. Along with predicting the future values of stocks, we will provide features like fundamental information of the company, technical indicators, technical screeners and pattern recognition
There are may ways to garb a stocks data, but in this project we have Yfinance to grab the stock OHLC data for the past 10 years.
This project contains most primarily 2 steps,
- Model Comparison - Training and experimenting which Machine Learning models perform best.
- Building the third party webapp - After training several models we can actually use the best model in our webapp to provide the best results.
As the main focus of the project is to develop an efficient and robust machine learning model to predict the next day's price so I have trained and fitted 3 different traditional Machine Learning and 1 deep learning model that is LSTM (Long Short Term Memory).
I have used three different Machine Learning models that are Linear Regression, K-Nearest Neighbors and Moving Average and then I used a deep learning model which is the LSTM model to fit on the historical data.
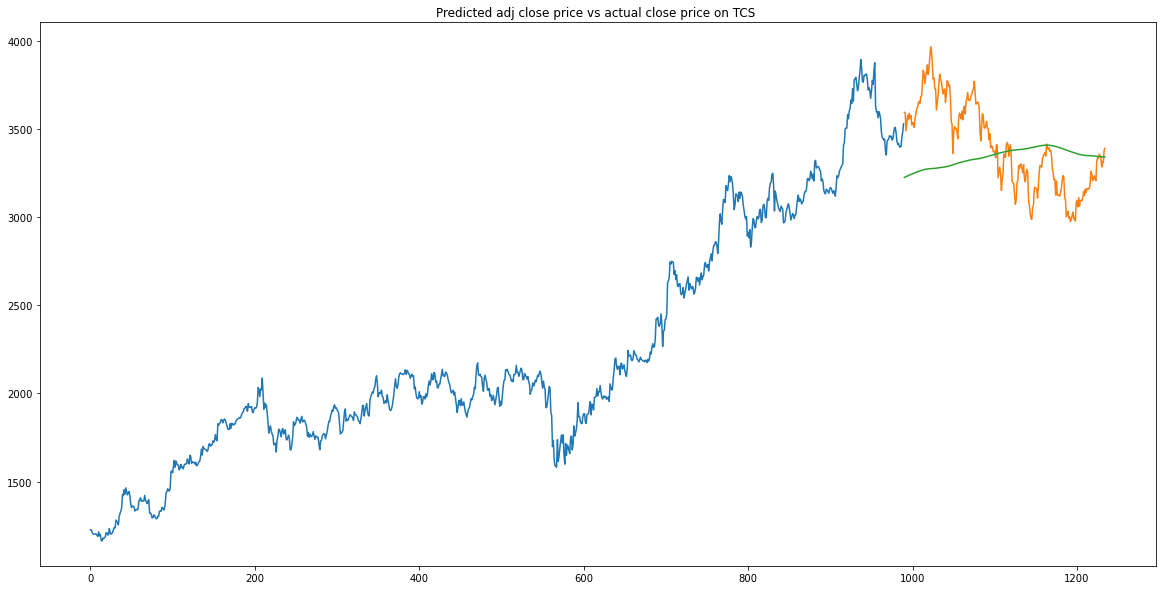
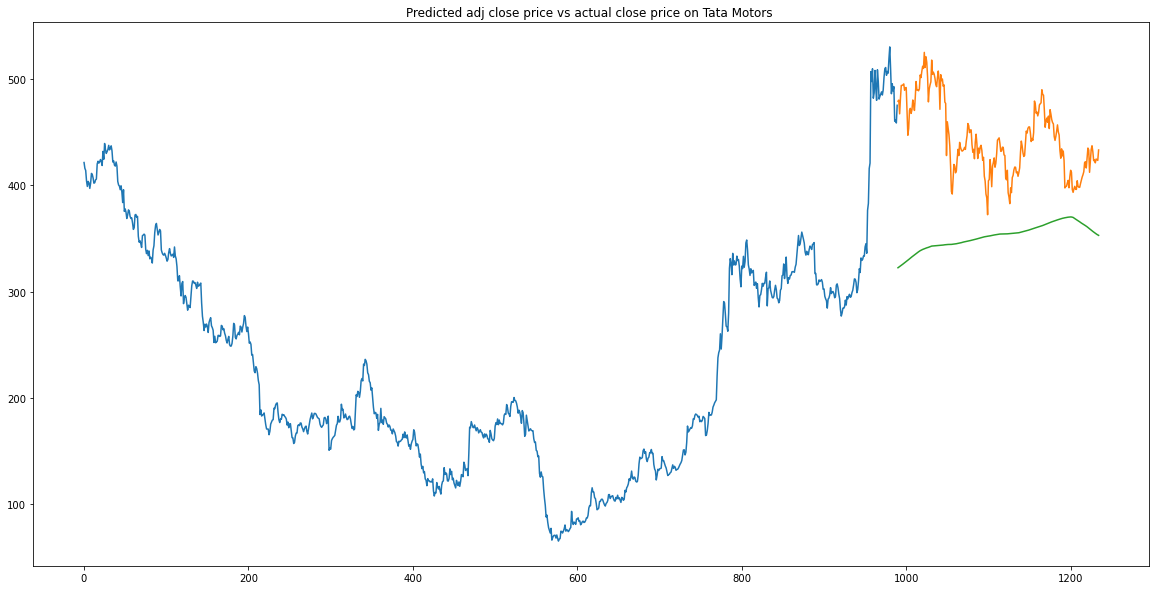
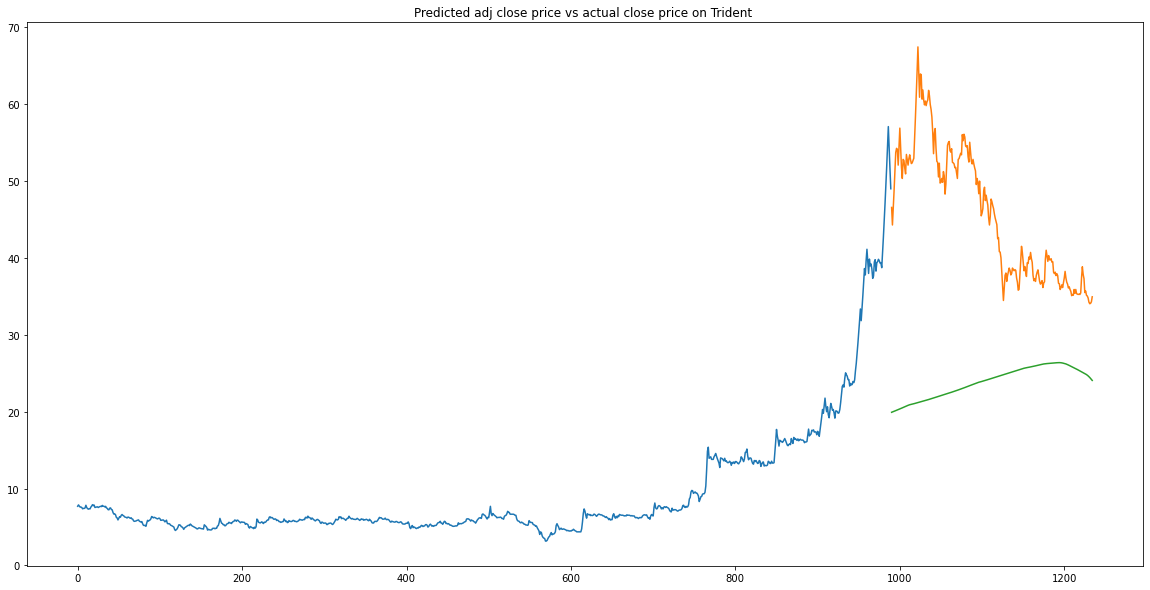
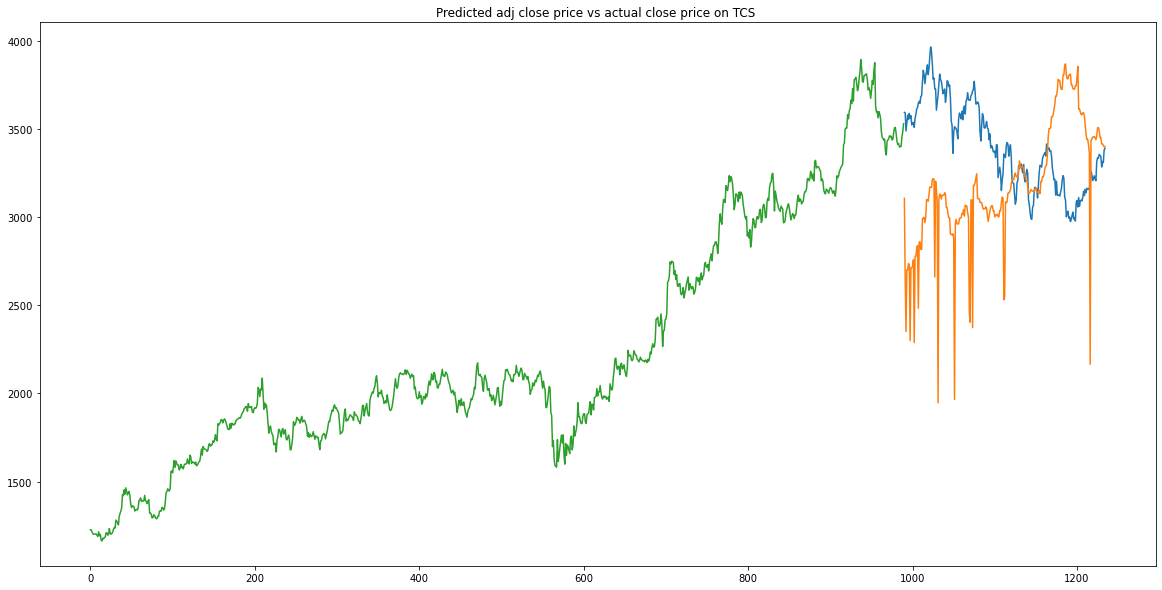
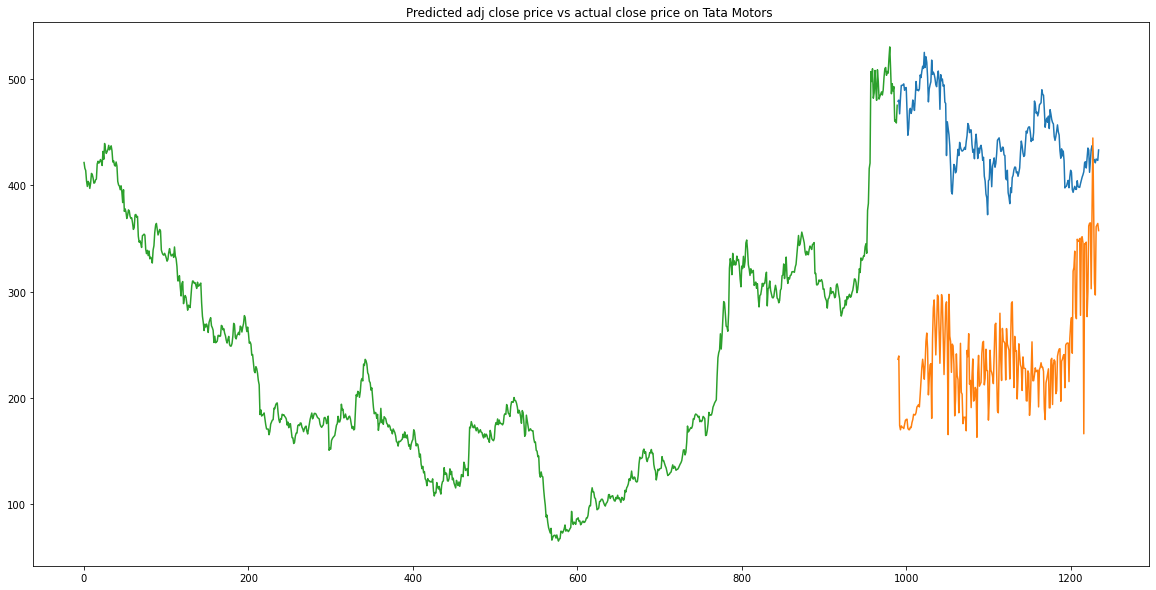
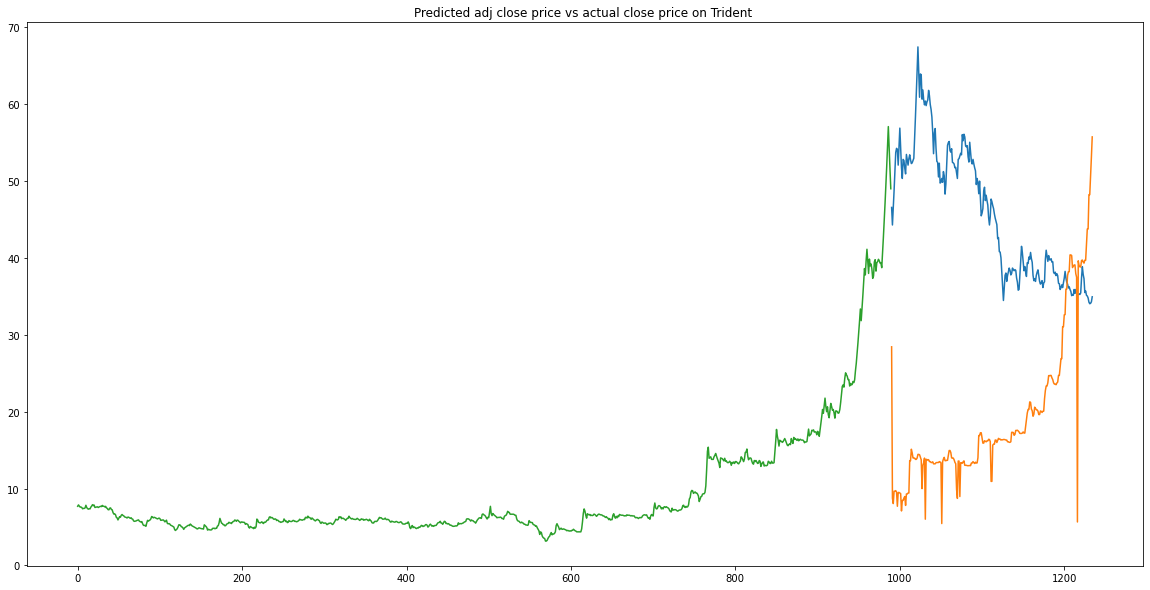
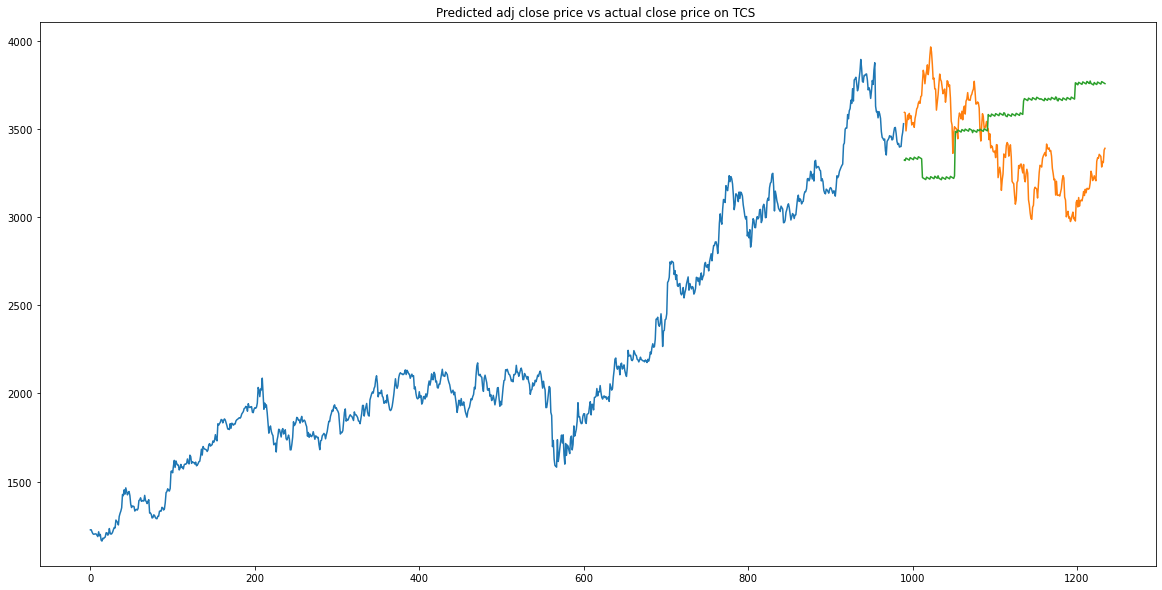
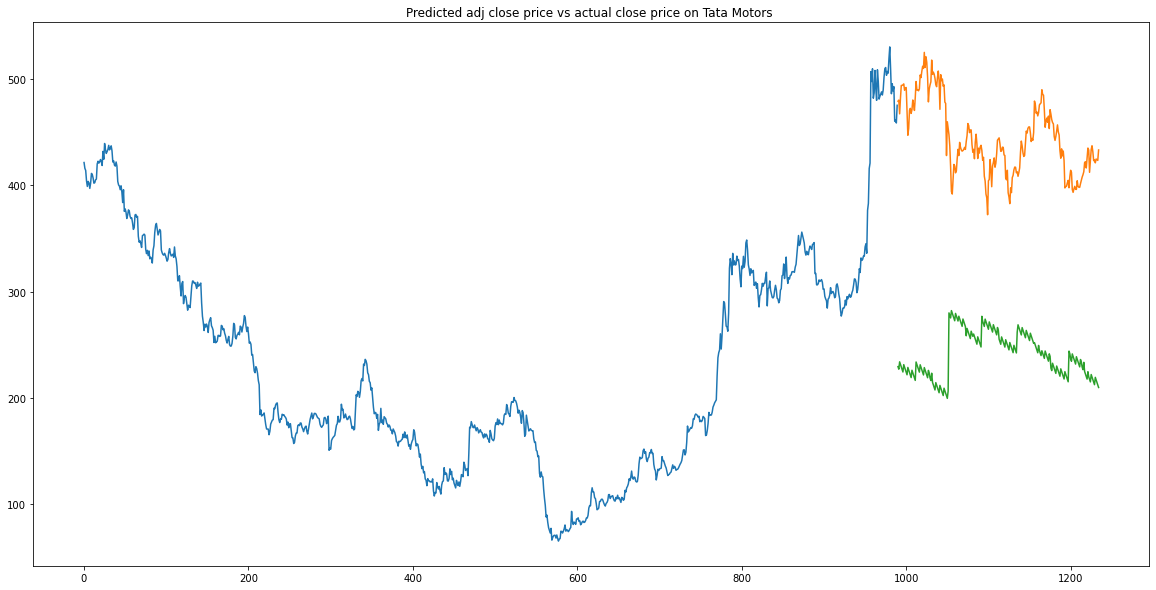
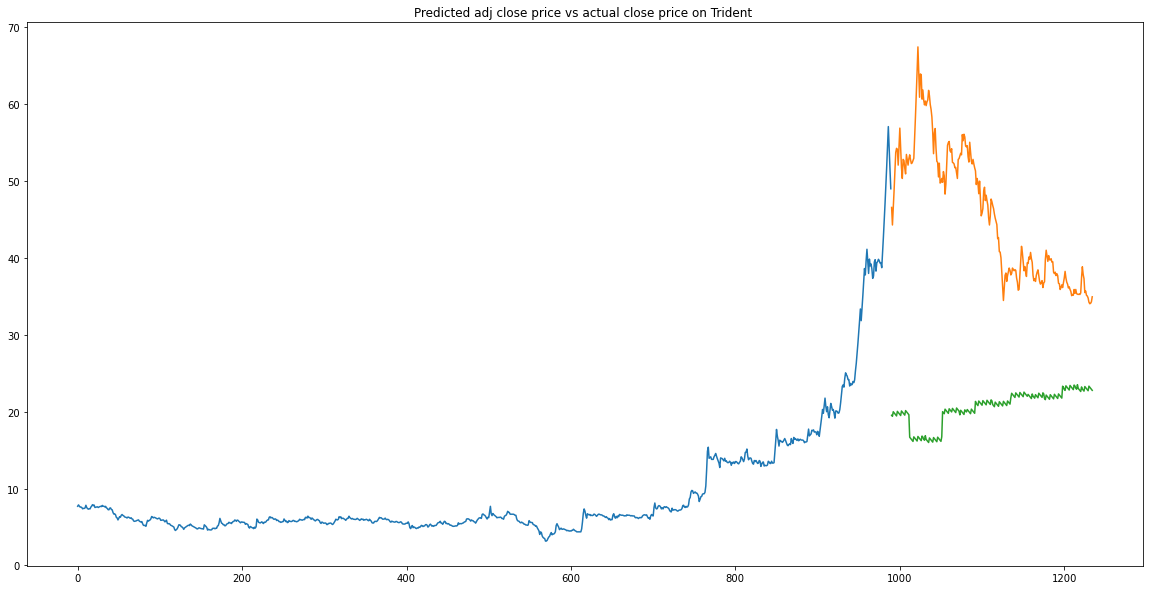
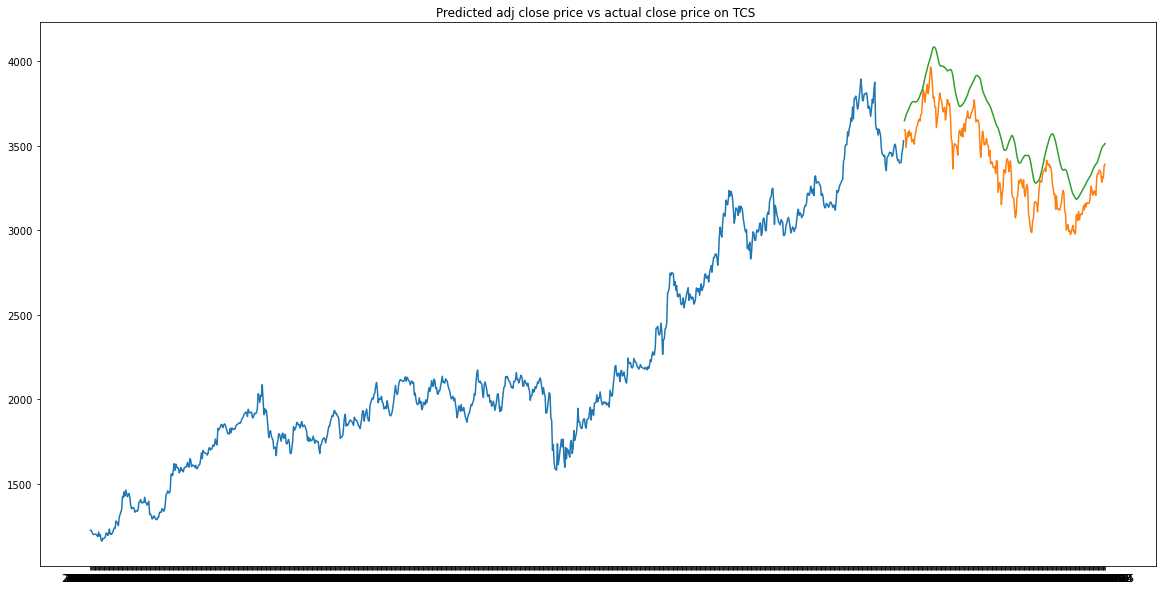
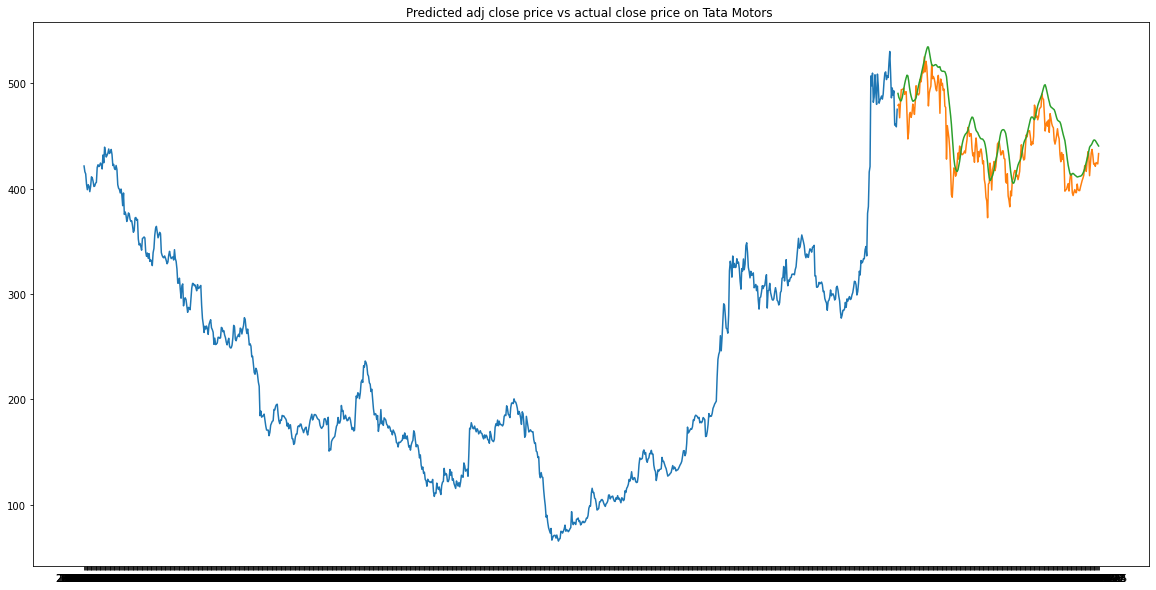
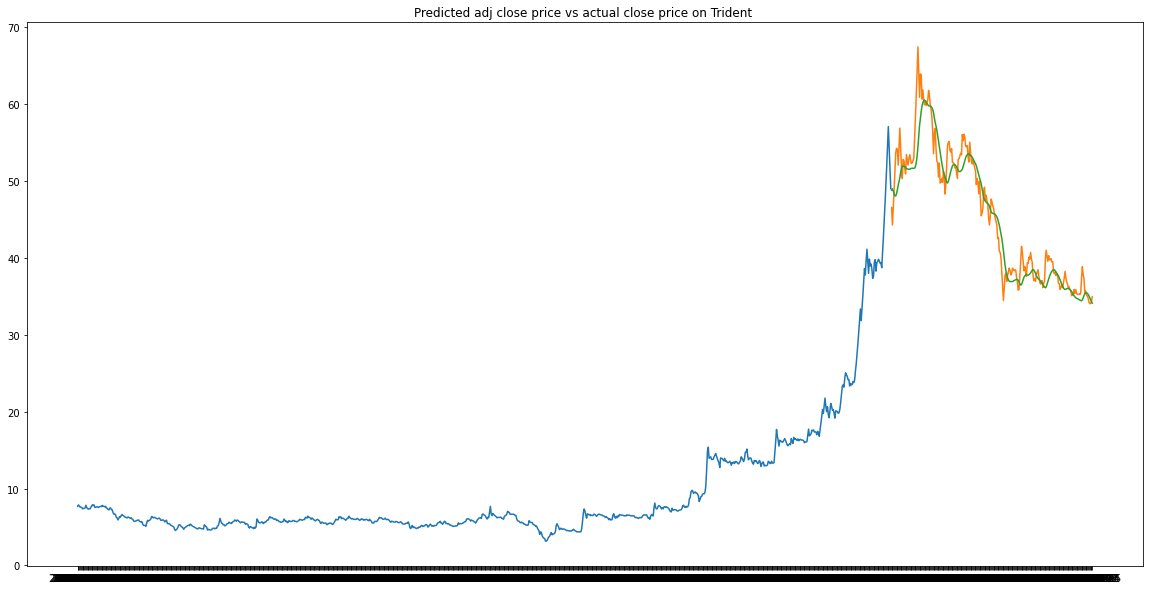
So to make our model efficient and robust we fitted these four models with different types of stock/company that are large-cap, mid-cap and small-cap. After fitting the model we have plotted the actual and predicted values and used the RMSE metric so we can decide which model to choose.
Now we will see hwo different models perform on different stocks.
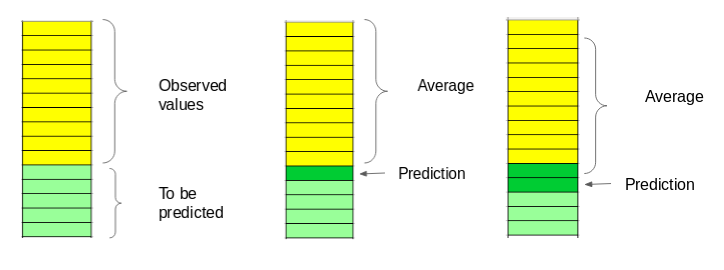
The predicted closing price for each day will be the average of a set of previously observed values. Instead of using the simple average, we will be using the moving average technique which uses the latest set of values for each prediction. In other words, for each subsequent step, the predicted values are taken into consideration while removing the oldest observed value from the set. Here is a simple figure that will help you understand this with more clarity.
Another interesting ML algorithm that one can use here is kNN (k nearest neighbours). Based on the independent variables, kNN finds the similarity between new data points and old data points.
The most basic machine learning algorithm that can be implemented on this data is linear regression. The linear regression model returns an equation that determines the relationship between the independent variables and the dependent variable.
LSTMs are widely used for sequence prediction problems and have proven to be extremely effective. The reason they work so well is because LSTM is able to store past information that is important, and forget the information that is not. LSTM has three gates:
-
The input gate: The input gate adds information to the cell state
-
The forget gate: It removes the information that is no longer required by the model
-
The output gate: Output Gate at LSTM selects the information to be shown as output
What is RMSE?
Root Mean Square Error (RMSE) is a standard way to measure the error of a model in predicting quantitative data.
It should be minimum always.
| Model | Large cap | Mid Cap | Small Cap |
|---|---|---|---|
| Moving Average | 971.40 | 234.64 | 23.10 |
| kNN | 1174.90 | 232.54 | 23.02 |
| Linear Regression | 680.51 | 400.30 | 24.51 |
| LSTM | 117.49 | 24.47 | 2.88 |
We can clearly see LSTM has the very low error compare to other models and on graph we can also see it can predict the prices close to the actual price than any other model.
So we will use LSTM model in our webapp to predict the prices.
In this step we will create a Web App with the python library Streamlit in which we will have a features like
-
Fundamental Information This feature consists of all the fundamental information of the company from historical prices to balance sheet, financials results, splits, and dividends. For the selected company, it will display all the information of the company.
-
Technical Indicators
This feature consists of the 10+ famous technical indicators that most traders and investors use while investing. It needs historical prices of the company for calculating, so it will grab the prices from yfinance then it will perform calculations, and then plot it to make it more interactive.
Which 10 Indicators?
-Moving Average -Schaff Trend Cycle (STC) -TRIX Indicator -Relative Strength Index (RSI) -Moving Average Convergance Divergence (MACD) -Aroon Indicator -AVerage Directional Index (ADX) -KAMA Indicator -Bollinger Bands -Average True Range (ATR) -
Technical screener
This feature consists of some technical screeners or parameters that are important while investing. It shows parameters like Relative Strength Index, 52-week low, 52-week high, Moving Average, and many more.
-
Pattern Recognition
In the stock market there are different candlestick patterns that give signals whether it goes uptrend or downtrend. But most of the traders do this manually by looking at the screen the whole time. So we are taking to the next step by giving the signals without looking at the screen the whole time. So in this feature for the selected company, it will scan through all the 60 different candlestick patterns and it will give signals whether it is bullish, bearish, or neutral.
-
Next-Day Forecasting
This is our main and most important module of the project. In this feature we will deploy our best performing ML model that is LSTM. It is fitted on past % years of OHLC data and it will look into past 60 days to forecast the price of upcoming day.
- Through this project I have learned that stock market is very volatile and one needs to be very careful while trading.
- Recommendation would be, one can explore more models which can perform well than LSTM or hypeetune this one to gain more precise values.
- Predicting how the stock market will perform is one of the most difficult things to do. There are so many factors involved in the prediction – physical factors vs. psychological, rational and irrational behavior, etc. All these aspects combine to make share prices volatile and very difficult to predict with a high degree of accuracy.
- There is so much scope for the stock market in India as it is booming nowadays. Our web app has the best efficient machine learning model with great accuracy and has a lot of other features.
- But as we all know while trading there are different timeframes that traders use, for example, minutes timeframe like 1m, 5m, 15m, 30m and hourly timeframes like 1h, 2h, 3h, 4h and daily timeframes like 1-day, 1-week, 1-month. So as for now, we have included only a 1-day timeframe, so in the future, we can at least have some more timeframes to work with.
To explore the notebook file here
size of the video is more than 25 MB so I uploaded it on YT
Clone the project
git clone https://github.com/sumittttttt/Stock-market-prediction-and-screener.gitGo to the project directory
cd Stock-market-prediction-and-screenerInstall packages
pip install -r requirements.txtAfter installing all the packages
Run the webapp
streamlit run main.py
This will open the webapp in your default browser
Bacause of TALib python package I am unable to deploy at this moment, but I will find a way soon.