Lancet Inf Dis Article: Here. Mobile Version: Here. Data sources: Full list. Downloadable database: GitHub, Feature Layer.
Lead by JHU CSSE. Technical Support: Esri Living Atlas team and JHU APL. Financial Support: JHU, NSF, Bloomberg Philanthropies and Stavros Niarchos Foundation. Resource support: Slack, Github and AWS. Click here to donate to the CSSE dashboard team, and other JHU COVID-19 Research Efforts. FAQ. Read more in this blog. Contact US.
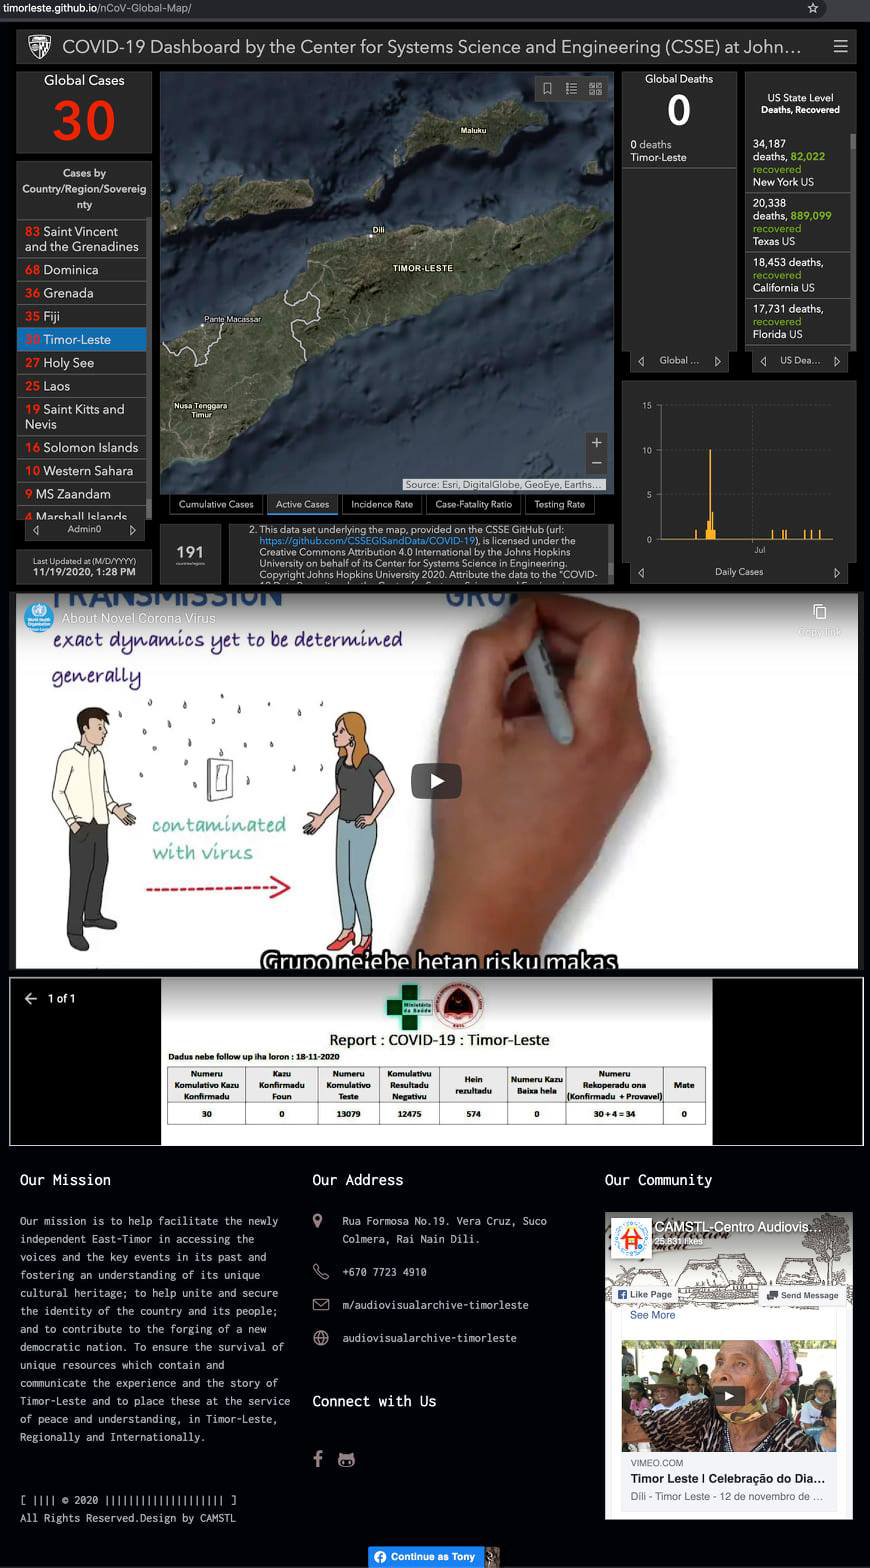
Cases and Death counts include confirmed and probable (where reported). Recovered cases are estimates based on local media reports, and state and local reporting when available, and therefore may be substantially lower than the true number. US state-level recovered cases are from COVID Tracking Project. Active cases = total cases - total recovered - total deaths. Incidence Rate = cases per 100,000 persons. Case-Fatality Ratio (%) = Number recorded deaths / Number cases. US Testing Rate: = total test results per 100,000 persons. The "total test results" are equal to "Total test results (Positive + Negative)" from COVID Tracking Project.
Point level: Admin2 Level (County) - US only; Admin1 Level (Province/State); Admin0 Level (Countries/Regions/Sovereignties). All points (except for Australia and Italy) shown on the map are based on geographic centroids, and are not representative of a specific address, building or any location at a spatial scale finer than a province/state. Australian and Italian dots are located at the centroid of the largest city in each state.
Time Zones: lower-left corner indicator - your local time; lower-right corner plot - UTC.
Note: All cases of COVID-19 in repatriated US citizens from the Diamond Princess are grouped together. These individuals have been assigned to various quarantine locations (in military bases and hospitals) around the US. This grouping is consistent with the CDC.
*The names of locations included on the Website correspond with the official designations used by the U.S. Department of State. The presentation of material therein does not imply the expression of any opinion whatsoever on the part of JHU concerning the legal status of any country, area or territory or of its authorities. The depiction and use of boundaries, geographic names and related data shown on maps and included in lists, tables, documents, and databases on this website are not warranted to be error free nor do they necessarily imply official endorsement or acceptance by JHU.
Terms of Use:
This website and its contents herein, including all data, mapping, and analysis are copyright 2020 Johns Hopkins University, all rights reserved. When linking to the website, attribute the Website as the "COVID-19 Dashboard by the Center for Systems Science and Engineering (CSSE) at Johns Hopkins University" This data set underlying the map, provided on the CSSE GitHub (url: ), is licensed under the Creative Commons Attribution 4.0 International by the Johns Hopkins University on behalf of its Center for Systems Science in Engineering. Copyright Johns Hopkins University 2020. Attribute the data to the "COVID-19 Data Repository by the Center for Systems Science and Engineering (CSSE) at Johns Hopkins University" or "JHU CSSE COVID-19 Data" for short, and the url: . For publications that use the data, please cite the following publication: "Dong E, Du H, Gardner L. An interactive web-based dashboard to track COVID-19 in real time. Lancet Inf Dis. 20(5):533-534. doi: 10.1016/S1473-3099(20)30120-1"
Visit the Johns Hopkins Coronavirus Resource Center where our experts help to advance understanding of the virus, inform the public, and brief policymakers in order to guide a response, improve care, and save lives.