A tool for running natural language processing pipelines in Python.
The initial version of this project was written over the course of a 7-part TDD livestream video series on YouTube: https://www.youtube.com/watch?v=pgWmEm2CNnw
To run unit tests: $ pytest
Currenly supports pattern-matching methods for:
- Sentence extraction from raw text
- Word tokenization (builtin stopword removal)
- Sentence-based sentiment polarity analysis on lists of tokens
The pipelines module exposes the SimplePipeline object, which can be used to pipe raw text data through assembled features. Features are provided to a new instance of SimplePipeline along with initial raw text. The output of each feature in a pipeline is returned to the input param of the subsequent feature in the list.
To set up a basic sentiment analysis pipeline from a text file on disk:
# specify the features you'd like to run
features = ['sent_tokenize', 'word_tokenize', 'score_sentiment']

with open('alice.txt', 'r') as f:
  pipeline = SimplePipeline(f, features)

# run the pipeline
pipeline.run()

# various features are now available as class attributes on `pipeline`:
pipeline.vocab_size  # 2452
pipeline.tokenized_sents[371]  # 'she found ample scope for admiration and delight'
pipeline.sent_scores[371]  # 0.6
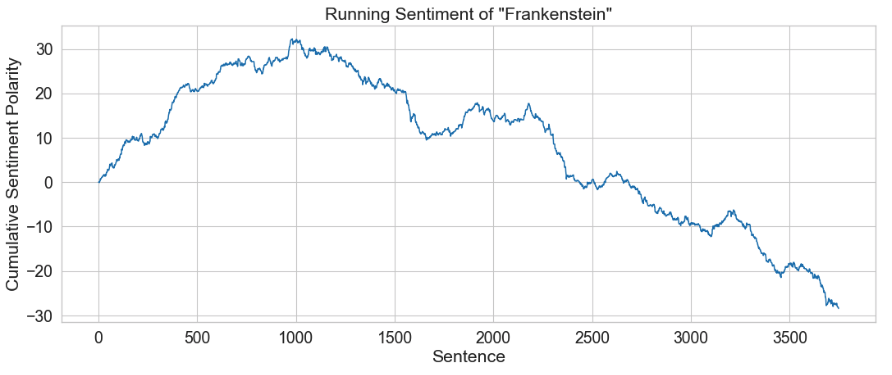
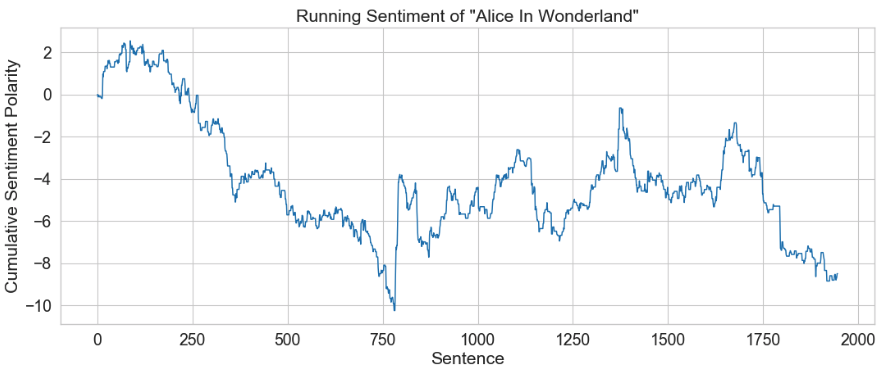
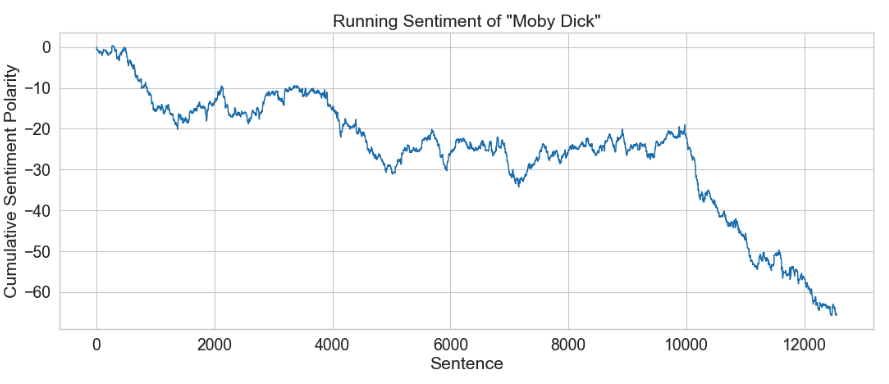
The pipeline provides a useful object for downstream operations, like EDA:
# extacted data can be used for downstream ops, like EDA:
import pandas as pd
import matplotlib.pyplot as plt
import seaborn as sns

# Grab the sentences and scores from the pipeline object, which has been fit to a text sample.
sents = pipline.tokenized_sents
scores = pipeline.sent_scores

# Prepare data from pipeline
df = pd.DataFrame(list(zip(sents, scores)))
df['time_series'] = df[1].cumsum()  # Taking the running cumulative sum of the sentiment score
data = {'sents': df.index.values, 'polarity': df['time_series'].values}

# Plot
plt.figure(figsize=(16, 6), dpi=80)
sns.set_style("whitegrid")
sns.set_context("notebook", font_scale=1.6, rc={"lines.linewidth": 1.3})
graph = sns.lineplot(x="sents", y="polarity", data=data, legend='full')
graph.set(xlabel='Sentence', ylabel='Cumulative Sentiment Polarity', title="Running Sentiment of \"Frankenstein\"")Positive and Negative word lists adapted from:
Minqing Hu and Bing Liu. "Mining and Summarizing Customer Reviews." Proceedings of the ACM SIGKDD International Conference on Knowledge Discovery and Data Mining (KDD-2004), Aug 22-25, 2004, Seattle, Washington, USA
Bing Liu, Minqing Hu and Junsheng Cheng. "Opinion Observer: Analyzing and Comparing Opinions on the Web." Proceedings of the 14th International World Wide Web conference (WWW-2005), May 10-14, 2005, Chiba, Japan.


