This repository contains code for maintenance of a dataset containing research quality T1 MRI images (e.g., resolution of 1mm isotropic or below) of healthy controls (no history of neurological disorder) scanned at the University of Pennsylvania (N=868).
The impetus of this project was to create a cortical thickness template including subjects across the entire age spectrum for calculating "neuroprint" heatmaps that illustrate an individual's age-adjusted atrophy. The repository for that initiative can be found here.
The data were gathered into a Flywheel Collection and visually inspected for motion and other artifacts.
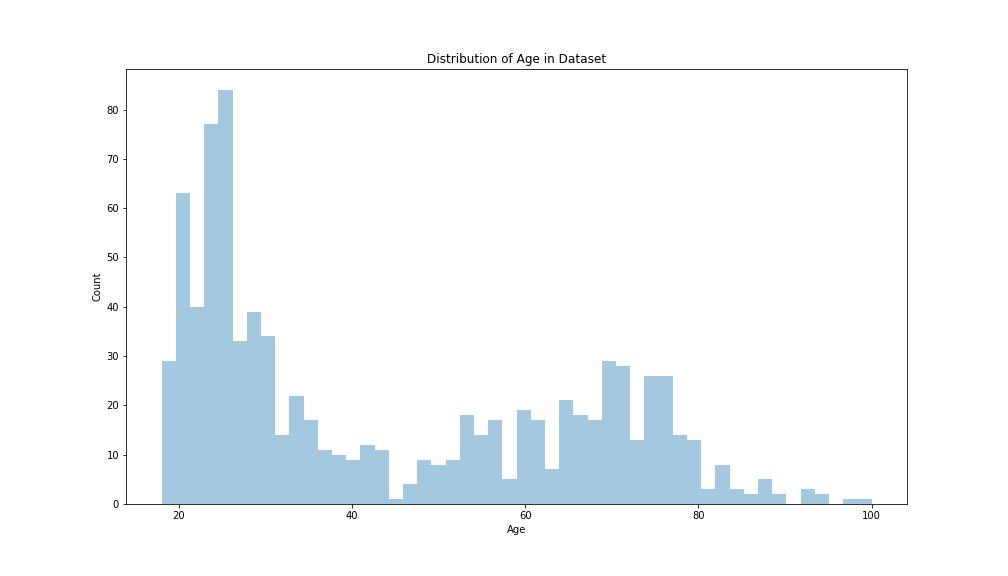
Visualization of the age distribution:
Breakdown of contributions by group, calculated using code/accounting.ipynb:
| Group | Age (mean) | Age (sd) | % Female | N |
|---|---|---|---|---|
| Connectome | 28.190698623657227 | 8.111772537231445 | 41.86046511627907 | 43 |
| Penn FTD Center | 39.57398986816406 | 19.1475887298584 | 56.82326621923938 | 447 |
| Davis Group | 32.681251525878906 | 11.379103660583496 | 56.25 | 16 |
| David Wolk Lab | 68.16585540771484 | 15.615558624267578 | 64.8780487804878 | 205 |
| Detre Group | 28.669353485107422 | 5.744270324707031 | 53.2258064516129 | 62 |
| Oathes Lab | 30.515789031982422 | 10.496979713439941 | 56.84210526315789 | 95 |
