A Colorado Board of Elections employee asked me to determine the following election outcomes in order to complete the election audit of a recent local congressional election.
- Calculate the total number of votes cast.
- Calculate the total number of votes each candidate received.
- Calculate the percentage of votes each candidate won.
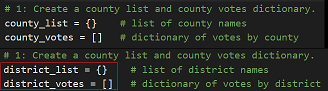
- Calculate the voter turnout for each county.
- Calculate the percentage of votes from each county.
- Determine the winner of the election based on popular vote.
- Determine the county with the highest turnout.
- Data Source: election_results.csv
- Software: Python 3.9.7, Visual Studio Code, 1.52.1
The analysis of the election show that:
-
There were 369,711 votes cast in the election.
-
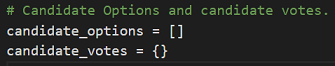
The candidates were:
- Candidate Charles Casper Stockham
- Candidate Diana DeGette
- Candidate Raymon Anthony Doane
-
The candidate results were:
- Candidate Charles Casper Stockham recieved 23.0% of the vote and 85,213 number of votes.
- Candidate Diana DeGette recieved 73.8% of the vote and 272,892 number of votes.
- Candidate Raymon Anthony Doane recieved 3.1% of the vote and 11,606 number of votes.
-
The winner of the election was:
- Candidate Diana DeGette who received 73.8% of the vote and 272,892 number of votes.
-
The counties in this election were:
- Jefferson county
- Denver county
- Arapahoe county
-
The county results were:
- Jefferson county cast 10.5% of the vote and 38,855 total votes.
- Jefferson county cast 82.8% of the vote and 306,055 total votes.
- Jefferson county cast 6.7% of the vote and 24,801 total votes.
-
The largest county turnout in this election was:
- Denver county who cast 82.8% of the vote and 306,055 total votes.
The script used to create this analysis of the election could be used to gather similar data in any election.
-
For a presidential election, a state could update the county analysis to list each district or precinct in a state. Then you would be able to determine the total and percentage of votes for each district, as well as get a total and percentage for the entire state for each candidate.
-
A school could remove or ignore the county analysis section and just use the candidate information in order to hold a class president or similar election. Allowing them to see the number and percentage of votes for each candidate, as well as the winner.