-
Notifications
You must be signed in to change notification settings - Fork 1
Real Time Assessment
A page describing steps taken to assess the performance of the system in response to interactions from the user.
The testing was performed by measuring the time delays between certain events during runtime. These events were flagged through the manipulation of GPIO pins, using the PiGPIO library.
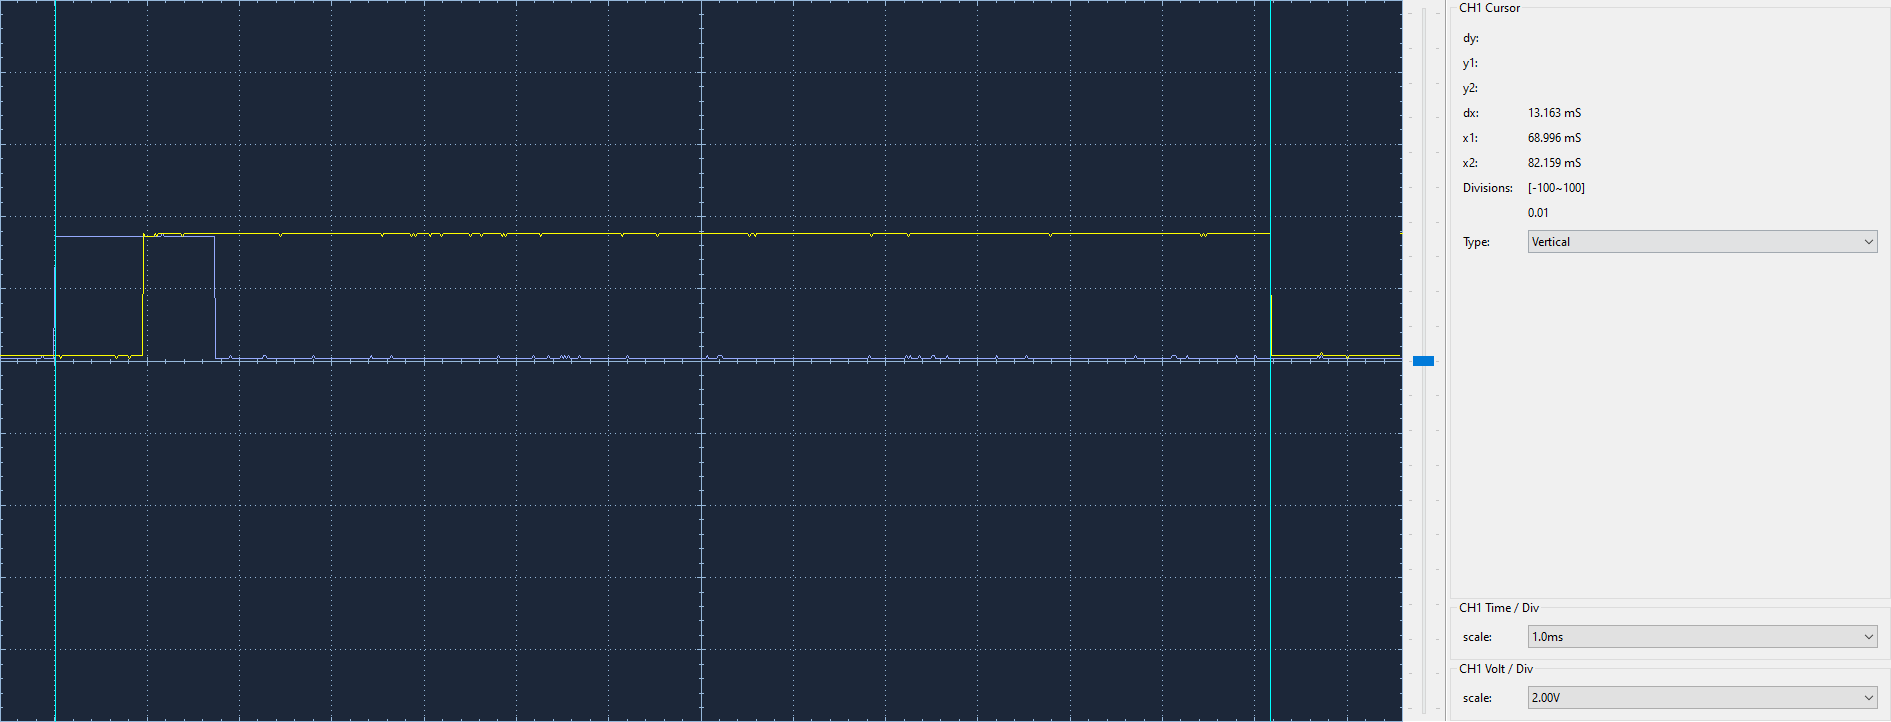
When the rt_test boolean flag is set to true within the main.cpp file of GameSystem the output from GPIO pins pin 13 and pin 26 can be observed with an oscilloscope.
- keep in mind The MPU6050 accelerometer sample rate is 1kHz, with a maximum of one value sampled every millisecond.
When a motion interrupt is triggered by the movement of the X or Y axis during runtime, pin 13 is pulled high by the MPU6050 as a motion-detect interrupt. The motion-detect interrupt handler associated with pin 13 is called, including a second flag check which then pulls pin 26 high. At the end of the game loop, this pin is then pulled low, and the process may be triggered again on the next interrupt and loop.
The first metric recorded was the timeframe in which pin 26 is high within the loop. This can be considered the total time for the system to process a motion-detect interrupt - referred to as a 'loop' measurement within the data analysis. The second metric was the duration between the motion-detect interrupt rising edge and the pin 26 rising edge - referred to as the 'first reaction' by the system, or how long it takes the system to observe the interrupt and set pin 26 high.
| Sample Number | First Reaction (ms) | Loop - Clear (ms) | Loop - Menu (ms) | Loop - Play (ms) | Loop - TestMap (ms) |
|---|---|---|---|---|---|
| 1 | 0.579 | 6.119 | 13.163 | 7.157 | 8.742 |
| 2 | 1.083 | 5.507 | 13.069 | 6.825 | 8.775 |
| 3 | 1.083 | 4.962 | 11.572 | 7.649 | 9.387 |
| 4 | 0.758 | 3.402 | 11.365 | 6.771 | 9.512 |
| 5 | 0.574 | 4.377 | 11.04 | 6.002 | 9.209 |
| 6 | 1.062 | ||||
| 7 | 1.127 | ||||
| 8 | 0.238 | ||||
| 9 | 1.04 | ||||
| 10 | 1.093 |
Where:
- Clear is a clear screen not checking or simulating any collisions or physics objects.
- Menu is the main menu screen populated by four collision buttons and a Marple as a selector - surrounded by a thin wall border.
- Play is the initial menu screen directly after the logo splash screen, which is actively rendering and simulating a Marple and a singular play button collision object.
- TestMap is a basic gameplay environment with Walls, several Holes, a Marple and an Endzone - the physics of which are simulated.
| Measurement | First Reaction (ms) | Loop - Clear (ms) | Loop - Menu (ms) | Loop - Play (ms) | Loop - TestMap (ms) |
|---|---|---|---|---|---|
| Range | 0.889 | 2.717 | 2.123 | 1.647 | 0.77 |
| Tolerance | 0.4445 | 1.3585 | 1.0615 | 0.8235 | 0.385 |
| Mean | 0.8637 | 4.8734 | 12.0418 | 6.8808 | 9.125 |
| Standard Deviation | 0.2926 | 0.93512 | 0.893824 | 0.539236 | 0.314534 |
- Range is the lowest value subtracted from the highest.
- Tolerance is half of the Range, as the potential +/- from the middle value.
- Mean is calculated appropriately.
- Standard Deviation is calculated appropriately.
From the results above, pages that contain many objects that are actively checking for collisions, such as a map or populated main menu screen, take much longer to complete a loop from interrupt to end.
The results from this experiment suggest that the performance of the system meets or surpasses the human perception time of 13-80ms [1] - providing no noticeable delay between the user interaction and the user experience.
