-
Notifications
You must be signed in to change notification settings - Fork 5
Species delimitation using Markov Chain Monte Carlo
We provide a Markov Chain Monte Carlo sampling method for assessing the confidence of the Maximum Likelihood delimitation scheme. The MCMC method is activated with the --mcmc switch followed by the number of MCMC steps and the switch for either the PTP model (--single) or the mPTP model (--multi). The user may define a number of additional parameters for the MCMC sampling as explained below.
#Overview of Command-line Parameters
| Parameter | Explanation |
|---|---|
--mcmc INT |
Support values for the delimitation (INT steps). |
--mcmc_sample INT |
Sample every INT iteration (default: 1000). |
--mcmc_log |
Log samples and create SVG plot of log-likelihoods. |
--mcmc_burnin INT |
Ignore all MCMC steps below threshold. |
--mcmc_runs INT |
Perform multiple MCMC runs. |
--mcmc_credible |
Specify the probability (0.0 to 1.0) for which to generate the credible interval i.e., the probability the true number of species will fall within the credible interval given the observed data. (default: 0.95) |
--mcmc_startnull |
Start each run with the null model (one single species). |
--mcmc_startrandom |
Start each run with a random delimitation. |
--mcmc_startml |
Start each run with the delimitation obtained by the Maximum-likelihood heuristic. |
The following command-line would execute a single MCMC analysis with 1 million steps and the mPTP :
$ mptp --tree_file tree_filename --output_file output_filename --mcmc 1000000 --multi --minbr 0.0009330519The --mcmc_sample option can be used for setting the frequency of the MCMC sampling. For example, with the following command the sampling frequency is set to 1/100, consequently, 10000 files will be written in the output file.
$ mptp --tree_file tree_filename --output_file output_filename --mcmc 1000000 --multi --minbr 0.0009330519 --mcmc_sample 100To assess convergence (see convergence), it is important to run at least two independent MCMC analyses. This can be done in one mptp execution with the command --mcmc_runs followed by the number of analysis you want to run. It is highly recommended to run at least two independent runs, as shown in the example below.
$ mptp --tree_file tree_filename --output_file output_filename --mcmc 1000000 --multi --minbr 0.0009330519 --mcmc_sample 100 --mcmc_runs 2It is also important in assessing convergence to use different starting delimitations for each MCMC run. By default, the starting point for each run is a randomly generated delimitation (--mcmc_startrandom). However a user may choose to start from the ML delimitation scheme (--mcmc_startml) or the null model, which assumes that all branch lengths fit a single exponential distribution.
For a single mcmc run, four files will be created:
-
filename.run_seed.stats: This file reports the frequency of all possible number of species for the input phylogeny (ie. 1 - n, where n is the number of tips in the phylogeny).
-
filename.run_seed.svg: This file corresponds to a graphical representation of the phylogenetic input tree. The support values for each node to be part of the speciation process is also provided in this file. The branches of the tree are colored with a gradient from black to red, scaled by the corresponding support values. If a branch is certainly part of the speciation process (i.e., the support value of its ascending node is 100%) it will be colored black and if branch is certainly part of the coalescence (i.e., the support value of its ascending node is 0) it is colored red.
-
filename.run_seed.tree. It contains the tree in format and the support values for the each node being part of the speciation process.
-
filename.run_seed.txt. It contains information about the run and the ML delimitation similar to the ML output.
If the --mcmc_log option is activated, two additional files will be generated:
-
filename.run_seed.log, contains the likelihood values in a text format.
-
filename.run_seed.logl.svg, plots the likelihood for every MCMC sample stored in memory (set by the
--mcmc_logoption).
Finally, if multiple mcmc runs are executed (i.e., --mcmc_runs > 1), then all of the output files described above will be created for each of the independent runs. Two additional files will be created:
-
filename.run_seed.combined.svg. A graphical representation of the phylogenetic input tree with the support values derived from all independent MCMC runs.
-
filename.run_seed.combined.tree. The phylogenetic input tree in newick format with the support values derived from all independent MCMC runs.
All trees in newick format can be visualized with software like figtree or icytree
All svg files can be visualized with any vector graphics editor (e.g. Inkscape) or web browser.
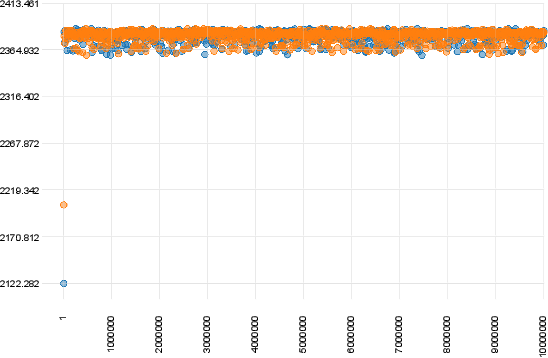
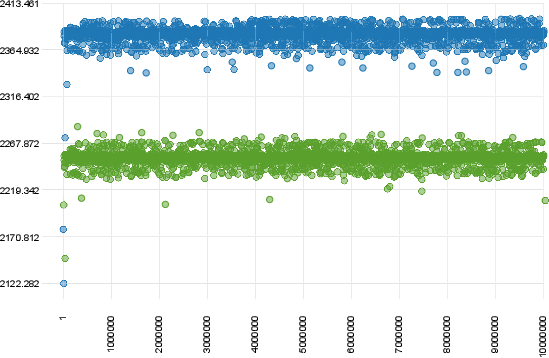
The visual inspection of the combined likelihood plot (filename.run_seed.combined.svg), provides a good impression on whether there was convergence of the different runs to the same likelihood.
The plot below shows a case of convergence of two runs that were executed for 10 million generations with a sampling frequency of 10000.

In contrast, the following plot shows a clear case of non convergence of the two runs.

In the output files [REF] of an MCMC run the
Support values indicate the fraction of sampled delimitations in which a node was part of the speciation process.
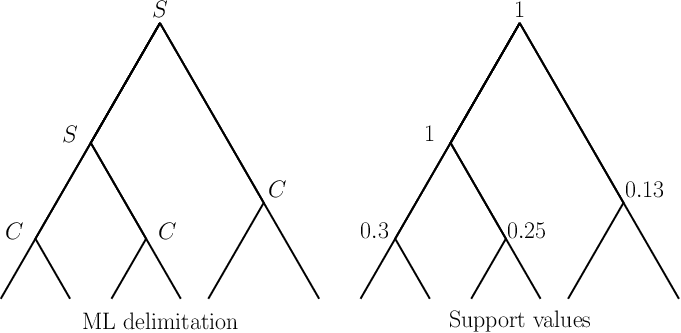
mPTP prints an Average Support Value (ASV) for each run. This is useful to assess the congruence of support values with the ML delimitation. Assume we have obtained the ML delimitation below (left tree) and using MCMC we obtain the support values for each node u shown in the right tree. Note that, the symbol S on the ML tree nodes indicates that the particular node belongs to the between-species splitting process, while C indicates the node is part of the within-species splitting process.

We compute the ASV using the following formula:

where

The resulting ASV for our particular example is

indicating that there is a 86.4% congruence between the support values and the point-estimate.
In the end of an MCMC run the ASV will be printed in the end of the screen as follows:
ML average support based on run with seed 268791095 : 0.98683685575051938
If more than one MCMC runs was ran (with --mcmc_runs > 1), the ASV for each of the runs will be printed in the screen:
ML average support based on run with seed 268791095 : 0.98683685575051938
ML average support based on run with seed 15357013 : 0.98533246567769028
The ASDDSV is inspired by the standard deviation of split frequencies (Ronquist et al., 2012) and it is used for quantifying the similarity among independent MCMC runs. To calculate it we average the standard deviation of per-node delimitation support values across the independent runs. ASDDSV approaches zero as runs converge to the same distribution of delimitations.
In the end of the MCMC runs the ASDDSV will be printed at the end of the screen as follows:
Average standard deviation of support values among runs: 0.001385