-
Notifications
You must be signed in to change notification settings - Fork 176
Practical treatment planning
- Open matRad’s graphical user interface (GUI) by executing 'matRadGUI' in the command prompt. In the upper left box click on the button ‘Load .mat’ and select the TG119.mat file to load the TG119 phantom dataset into matRad. You can find it in the subfolder phantoms.

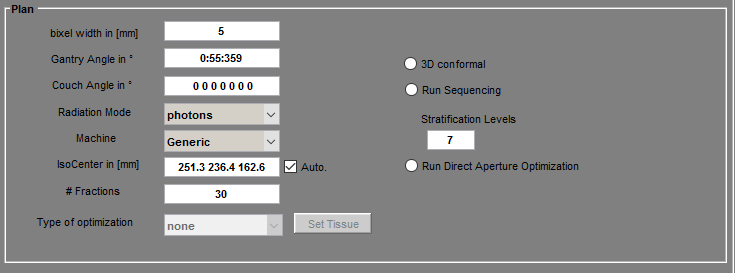
- Next, lets define the following treatment plan parameters:

Now the plan denotes an IMRT photon treatment plan comprised of five photon beams impinging in 75 degree gantry angle steps. The corresponding couch angles are set to 0 degree. In addition, the bixel spacing is set to 5mm.
- Next, define the following objectives for optimization in the table below:

By this means, we are penalizing a dose greater than 20 Gy to the core structure and a dose greater than 30 Gy to the BODY structure. In contrast, we prescribed a dose of 50 Gy to the target structure and penalized its under- and over-dosage equally. Please note that we have additionally defined a maximum dose constraint of 25 Gy for the core structure. This means that no single voxel in the core structure is allowed to exceed a dose value of 25 Gy.
- In the next step, calculate the dose influence matrix by clicking ‘Calc. influence Mx’. The dose deposition of each beamlet for unit intensity is now being calculated.

- After a successful dose calculation, we now want to optimize the dose distribution with respect to the objectives and the constraint we have previously defined in the table. Click the button ‘Optimize’.

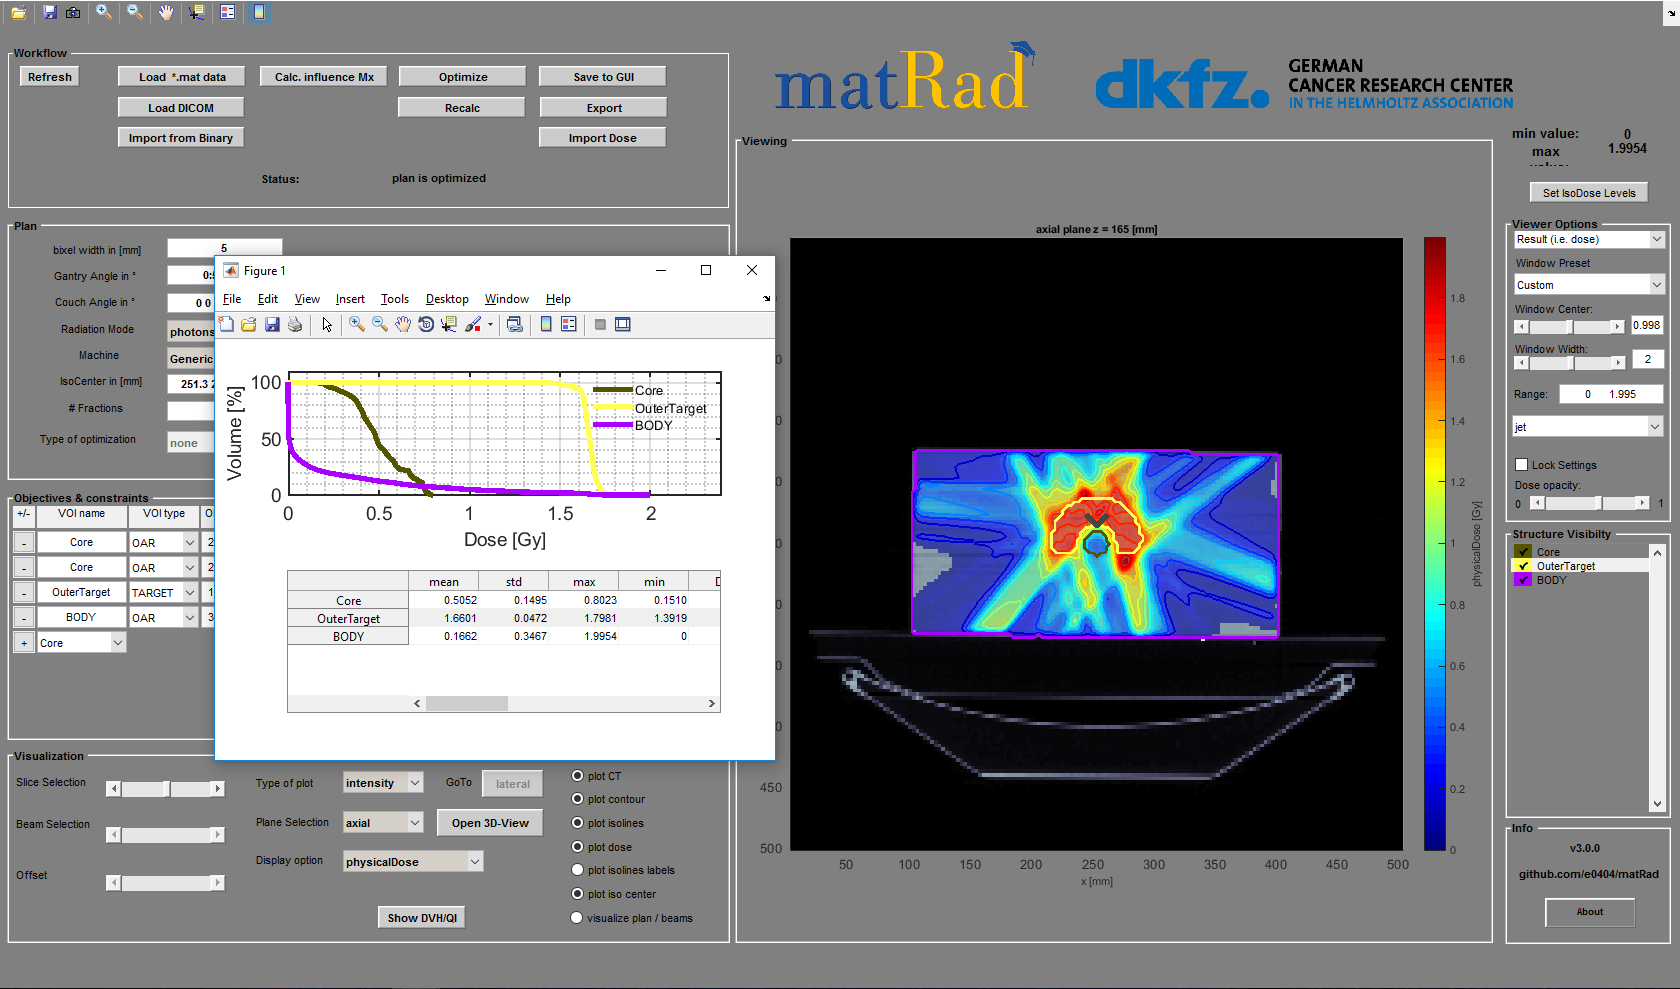
- After the optimization converges, the final dose distribution is displayed in the graphical user interface. Use the display options on the right hand side of the GUI to exploit the optimized dose distribution.

- Hit the ‘Save to GUI’ button to store the current result in the GUI. This allows you to create new treatment plans without losing existing results. In this case, we are labeling the result '5_beams' and save it.

- By clicking on the ‘Show DVH/QI’ button, the dose volume histogram is rendered along with quality indicators in a separate figure window. Since matRad is always optimizing the fraction-dose, you now have to check if the maximum dose constraint to the core structure is not violated. Check in the DVH and in the quality indicators if the dose to the core structure does not exceed 25 Gy / 30 fractions = 0.833 Gy per fraction. Explore the trade-off between target coverage and OAR sparing by (i) changing penalty and dose values and (ii) performing a re-optimization.

- Now let's define a new treatment plan with a finer gantry angle spacing. Instead of a 75 degree spacing we define a 55 degree spacing which results in 7 beams in total. Please also adapt the number of couch angles accordingly.

- As we have changed the treatment plan geometry we have to calculate a new dose influence matrix and have to optimize the dose distribution again. Thus click ‘Calc. influence Mx’ and then ‘Optimize’ (steps 4 and 5). Finally, visualize again the DVH and compare it to the previous DVH. The dose fall-off should now be steeper in the target compared to the 5 beam treatment plan. Now save again the current dose distribution as '7_beams_unseqeuenced' by clicking on the Save to GUI button. Next, assess the D95% (Target) of the current treatment plan.

- In the drop-down menu Display option you can now switch back to the dose distribution of the 5 beam treatment plan and compare it to the 7 beam treatment plan.

- Now turn on Run Sequencing with 3 stratification levels in the Plan Parameters section and Optimize again.

Next, determine the
- D95% (Target) to the sequenced treatment plan
- Change the number of stratification levels to 9.
- What happens to the D95% (Target)?
When hitting the camera icon on the upper left corner of the GUI you can save a screenshot of the current visualization.
Load a new patient by clicking on *Load .mat data and choose HEAD_AND_NECK.mat to load the head and neck patient case. You can find it in the subfolder phantoms. Next, inspect the geometry of the patient by scrolling through the axial slices. With Open 3D-View you get a 3 dimensional illustration of the patient.
Make sure the radiation mode is set to photons. You are free to choose the number of beams, the gantry and couch angles as well as penalties and dose objectives/constraints. The aim is to assess a treatment plan that fulfils the following criteria:
- D95% to PTV 63/70 at least 63/70 Gy
- Mean dose to parotid glands < 20 Gy
- Max dose to spinal cord < 50 Gy
- No dose hot spots in normal tissue
Next, set the radiation mode to protons and try to comply with the criteria above. You are free to choose the number of beams, the gantry angles, the couch angles, the penalty and the dose objectives.
- Open matRad’s graphical user interface (GUI) by executing 'matRadGUI' in the command prompt. In the upper right box click on the button ‘*Load .mat’ and select the TG119.mat file to load the TG119 phantom dataset into matRad. You can find it in the subfolder phantoms.

- Next, let's define the following treatment plan parameters:

Calculate the dose distribution for protons and then optimize it. Hit the Calc. influence Mx. and then the Optimize button.

- Compare the dose distribution to the photon treatment plan – what are the most striking differences?
- Compare the single beam proton treatment plan to the single beam photon treatment plan.
- Switch to carbon ions and select 'none' as type of optimization. Next, hit the Calc. influence Mx and then the Optimize button. What are the differences compared to the proton treatment plan, in particular when focusing on the core structure?

 -website