Strategy, Data Collection and interleaving
On this page, we discuss how strategies and data collections are related, and in particular the significance of interleaved data collection protocols.
A geometric strategy defines which reflections (i.e. spots) are going to be recorded and measured from a mounted and characterised crystal. This definition is expressed in terms of beamline instrumentation settings, specifically:
-
wavelength or energy
-
detector position
-
starting and ending settings of the scanning axis
-
for multi-axis goniostats (e.g. Kappa, SmarGon), the settings of the rotation axes other than the scanning axis
|
ℹ️
|
A geometric strategy as discussed here is defined with reference to the characterised properties of a particular mounted crystal. If the instrumentation settings from a geometric strategy are applied to another crystal (even in the same loop as the first), different reflections will be recorded. In other words, one set of these instrumentation settings, when applied to two different crystals, constitute two different geometric strategies. The minimal characterised properties of the crystal for these purposes are the orientation matrix and the crystal symmetry. |
A very simple example of a commonly-used geometric strategy for a single-axis goniostat is:
Wavelength |
1.04Å |
Detector distance |
200mm |
Omega |
0° - 180° |
This information is obviously not sufficient to actually collect MX data. More image-related information needs to be added to define a data collection, in particular:
-
Image width
-
Exposure time per image and beam intensity/attenuation
-
This determines the X-ray dose received at the sample for each image written
-
For practical purposes a filename template for the image files needs to be specified as well.
Some properties of a data collection from a characterised crystal can be predicted from the underlying geometric strategy alone. For example, the maximum achievable completeness of a data collection depends on the underlying geometric strategy, but is independent of certain parameters of the data collection such as the exposure time and image width. Optimising an MX experiment with respect to criteria such as the expected signal to noise ratio in an experimental phasing experiment makes use of such geometric properties. This is one of the reasons why the geometric strategy is a "first-class citizen" of the Abstract Beamline Interface, related to but distinct from a data collection.
|
ℹ️
|
The term "diffraction plan", while related to this discussion, is sometimes used in a way that is incomplete from a scientific perspective (i.e. depends on knowledge of, or assumptions about, protocols that are in operation at the beamline). We do not use it here. |
There are many MX experiments for which simple geometric strategies such as the one above are not appropriate, and need either extending or replacing with a different strategy entirely. For the purposes of discussion, let us consider extending the above strategy by adding a second wavelength:
Wavelengths |
1.04Å, 1.06Å |
Detector distance |
200mm |
Omega |
0° - 180° |
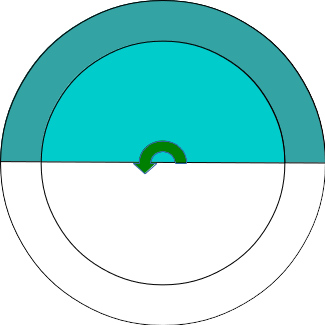
This strategy can be represented graphically as follows: the two concentric circles represent the two different wavelengths, and the blue areas are the range of Omega defined in the geometric strategy.
The simplest way of executing this strategy is to collect all the images at each of the two wavelengths in succession:
-
Omega 0° - 180°; wavelength 1.04Å
-
Omega 0° - 180°; wavelength 1.06Å
using the same image width, exposure time and beam intensity throughout. The problem with such a simple data collection is that the downstream computation associated with a multi-wavelength strategy like this one relies in part on analysis of differences between the intensities of corresponding reflections that have been recorded at different wavelengths but the same setting of Omega (more strictly, nearly the same setting of Omega). Collecting a complete set of images at one wavelength and then repeating at the other wavelength has the consequence that the intensities that are being compared have been recorded with very different X-ray doses having been received at the sample. The structure of the sample can be perturbed by this dose, which reduces the signal-to-noise ratio of the intensity differences. This perturbation is almost invariably undesirable, and is referred to as "radiation damage".
|
ℹ️
|
The signal that is derived from the intensity differences is referred to as "phase information" or "phases", and a favourable signal-to-noise ratio is critical to a successful outcome of the experiment. The phases contain much more information about the structure of the sample than is available from any treatment of the measured data that does not involve these intensity differences. |
|
ℹ️
|
Radiation damage can take the form of chemical changes to the sample (breaking inter-atomic bonds or other rearrangements of the atomic structure), of changes to the crystal lattice parameters (loss of isomorphism), or both, and more generally of a deterioration of diffraction quality. |
On a beamline where the wavelength can be changed reasonably quickly and reproducibly with good preservation of beam position and intensity, the signal-to-noise ratio for the intensity differences at the two wavelengths will be improved by interleaving the two wavelengths during the data collection, for example by using the following sequence:
-
Omega 0° - 10°; wavelength 1.04Å
-
Omega 0° - 10°; wavelength 1.06Å
-
Omega 10° - 20°; wavelength 1.04Å
-
Omega 10° - 20°; wavelength 1.06Å
-
Omega 20° - 30°; wavelength 1.04Å
-
Omega 20° - 30°; wavelength 1.06Å
-
… etc. …
Using the graphical form shown above, the growing yellow area shows the data collection proceeding one 10° scan at a time:

The interleaved and non-interleaved data collections are both described by the same geometric strategy. However, the dose that separates corresponding reflections that have been recorded at different wavelengths will be much smaller for the interleaved data collection than for the non-interleaved one.
Similar considerations apply to the inverse-beam protocol. The geometric strategy for an inverse-beam experiment might be something like this:
Wavelength |
1.04Å |
Detector distance |
200mm |
Omega |
0° - 100° and 180° - 280° |

In practice, the actual data collections based on such strategies never involve collecting images from the lowest value of Omega to the highest. They are always interleaved between Omega and Omega + 180°, for the same reason as in the multi-wavelength example. In the inverse-beam case, the downstream computation involves intensity differences between reflections that have been recorded 180° apart in Omega, and interleaving between the two parts of the strategy reduces the differential X-ray dose at the sample between such measurements:

Where a multi-axis goniostat is available, the geometric strategy may involve using more than one orientation of the sample. The orientation is defined by the settings of the rotation axes of the goniostat other than the scanning axis (for the mini-Kappa goniostat, these are the settings of Kappa and Phi). Some reflections may not be recordable at a particular orientation, so using more than one orientation improves the completeness of the data collection. Reasons for inaccessibility of some reflections include:
-
falling in the gaps between modules on a Pilatus detector
-
falling too close to the rotation axis to be recorded (the "cusp" or "blind" region)
The effect on data completeness of these factors is most severe for samples with low crystal symmetry.
A two-orientation geometric strategy may look like this:
Wavelength |
1.04Å |
Detector distance |
200mm |
Omega at Kappa=20° and Phi=35° (orientation 1) |
10° - 70° |
Omega at Kappa=-15° and Phi=140° (orientation 2) |
35° - 80° |
The strategy could be executed by first collecting the images at orientation 1, then at orientation 2. However, this strategy could also be implemented as an interleaved data collection:
-
Omega 10° - 20° at Kappa=20° and Phi=35°
-
Omega 35° - 45° at Kappa=-15° and Phi=140°
-
Omega 20° - 30° at Kappa=20° and Phi=35°
-
Omega 45° - 55° at Kappa=-15° and Phi=140°
-
… etc. …
In this case, the motivation for interleaving is different from the two cases above: there are not necessarily any direct comparisons to be made between the intensities of reflections recorded at different orientations. The point of interleaving in this case is to avoid one orientation having been used predominantly while the sample is fresh, and the other orientation only when the sample has already experienced a significant X-ray dose. This may help to disambiguate anisotropy in the diffraction limits (which is intrinsic to the sample) from a deterioration of those limits with increasing dose.