-
Notifications
You must be signed in to change notification settings - Fork 8
Loading and editing attributes
- Attributes and types
- Import attributes from your file
- Import attributes from databases
- Create your own attributes
- Edit your attributes
- Delete attributes
Attributes are information relative to the elements of the network: nodes and edges. For example, if your nodes represents the proteins in a cell, then an attribute can be the "cellular location". Each node (protein) would have a different attribute value (nucleus, cytoplasm, membrane, etc) for the attribute "cellular location". These attributes can be used to customise the network visualization by integrating onto it a variety of additional data of different nature.
For example, in the image below we use 1) the protein location to customise the node stroke color (green are proteins in the nucleus) and 2) time series of gene expression to display the node as a pie chart where pie colors and size represent the gene expression at each measurement point (gene expression is proportional to blue intensity and size).

To learn more about how to use attribute to custom the visualization: go to the Visualization and Advanced visualization sections.
When there is only one attribute value per node, then the attribute is simple (or a string). But there are cases when the information you want to integrate onto your network elements is not simple but complex. For example, imagine you want to represent the expression of a protein in 3 conditions. In these cases, the attribute is not simple but a list of values (concretely 3 values, one per condition). See the following example files:
- example: Network Small network of human proteins.
- example: Node attributes Table with attributes relative to the proteins (nodes). The first column contains the protein identifier, the second the cellular location (as single string) and the third the gene expression measured at three times (as list of numbers separated by ',').
When you upload a network, by default, it does not have any attribute. These attributes should be created or imported by the user.
Integrating data onto a network in the form of attributes is very easy: you can introduce directly this data going to Attributes > Edit attributes which offers you the possibility of editing these as if excel spreadsheet. Alternatively, we offer you the possibility of importing data from other databases by means of CellBase. Also, for a faster and customised integration, you can provide them by uploading a table or excel with the data you need. Just be sure that the first column of this table contains the Node or edge id you used to label these elements when you uploaded the network.
In the following sections there is a complete explanation on how to add, import, edit and remove attributes.
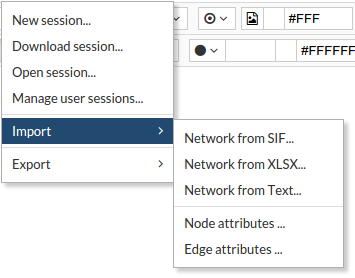
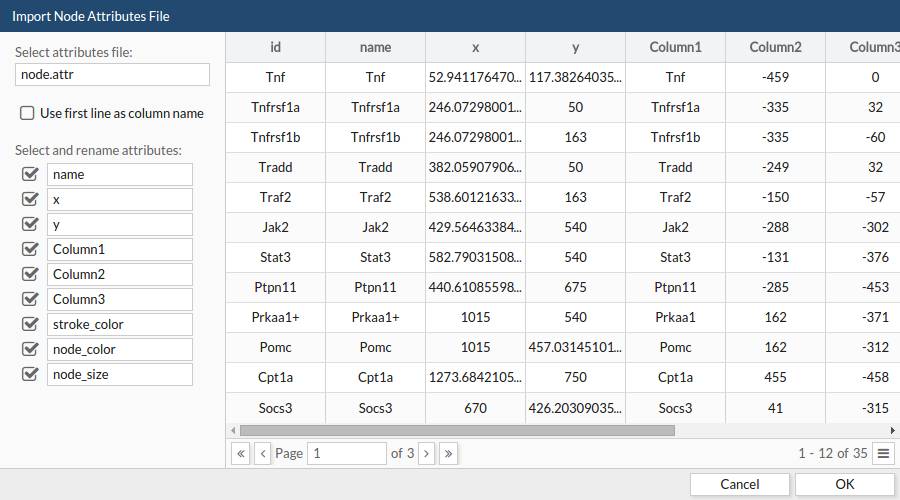
Upload your own attributes by going to File > Import > Node / edges attributes. A window will appear. Browse your file and click OK. Your file must be a flat text file, and the different attributes must be separated by a tab. Note that the first column must contain the name of the element that will be use to map the attributes.
A preview of your data will appear in the window like a spreadsheet. Select the columns you want to import as attributes. You can change the attribute names by editing the corresponding column header. Finally, you can also allow CellMaps to create new nodes for unrecognized names.
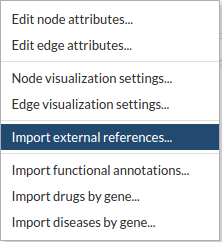
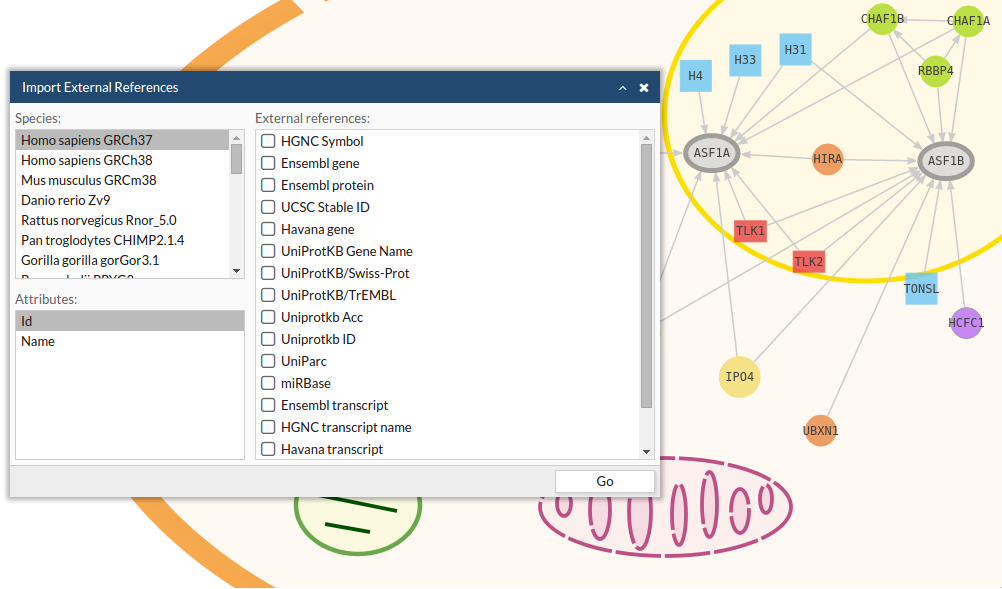
Import attributes from a bunch of databases through CellBase by going to Attributes > Import Attributes from CellBase.
You can create attributes directly on CellMaps by going to Attributes > Edit Node/Edge. An editor window will appear. To create an attribute, go to add attribute and expand the panel. First, write the name of the attribute, second select the attribute type and, finally, assign a default value. To save the attribute click on the apply button.
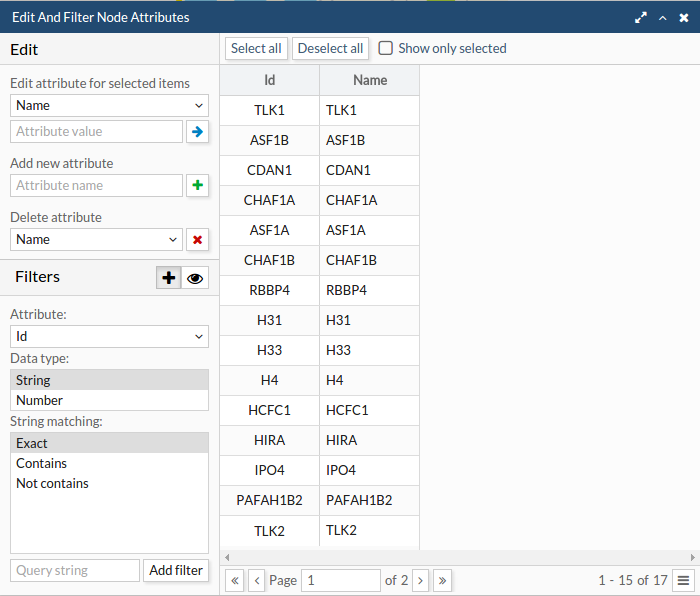
You can edit your attributes directly on CellMaps by going to Attributes > Edit Node/Edge. An editor window will appear. To modify attributes, go to Edit section. First, select the attribute name from the pull-down menu and, secondly, select the rows (nodes or edges) that you want to modify. NOTE that only the values for the selected nodes will be modified. To apply the change to all the elements just click on "select all" button. Finally, introduce the new attribute value and click the blue button.
Alternatively, you can modify directly the editable spreadsheet by double click on the spreadsheet cell and re-write the content. Changes will be automatically saved.
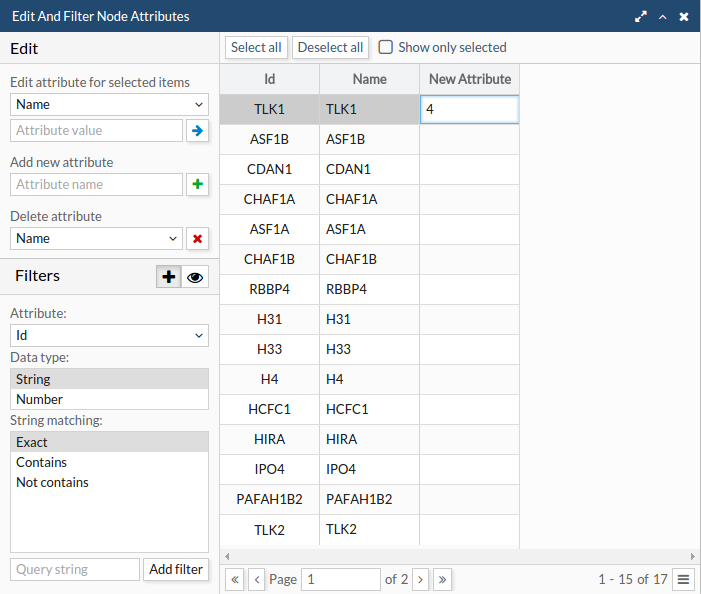
To remove an attribute, go to Attributes > Edit Node/Edge. Here in the delete attribute select the attribute name from the list and click on the apply button.
Once your network and attributes are loaded, you can continue your analysis by setting the visual style of you network (see Network and attributes visualization) and performing analysis onto it (see Analysis).