-
Notifications
You must be signed in to change notification settings - Fork 44
Fullwave
HELIOS++ supports simulation of full waveform data by simulating a laser beam cone of finite divergence via sampled subrays.
The quality of the simulation can be adjusted by the beamSampleQuality attribute of the <FWFSettings [...]/> tag in the survey XML. If no information is given there, the scanner definition may have a set of FWFSettings instead. If this is also not present, hardcoded default values are used, as shown in the following table:
| Attribute | Default value | Comment |
|---|---|---|
beamSampleQuality |
3 | 3 concentric circles of subrays, 19 subrays total, discretization in space |
binSize_ns |
0.25 | discretization in time |
maxFullwaveRange_ns |
0 | maximum time to record for a single pulse. 0 means no limit. (wait for last pulse) |
winSize_ns |
pulseLength_ns/4 |
pulseLength as defined in the scanner |
The beamSampleQuality
On one of these circles,
For example, the subrays for a beamSampleQuality of three look like this (color represents relative amplitude, see next section):

For every subray, the returned waveform is calculated by intersecting it with the scene. If the subray returns a hit, it does not continue onwards.
The received amplitude is derived from the LiDAR equation, considering the following items:
- Transmitted energy: The energy at a certain offset from the center ray is calculated as follows:
where
- Material - see different options and material definitions on the Scene page, using Phong's Bi-Directional Reflection Distribution Function (BDRF)(Phong, 1975)
- Target cross section, using the area illuminated by the subray and the local incidence angle
- Atmospheric and system efficiency.
In the time domain, the beam is modelled with the following function, where
which gives the following shape:

After the subrays have been cast and intersected with the scene, they are aligned according to their range, where the maximum position (the peak in the previous figure) corresponds to the position of the return, and the waveform shape is not altered e.g. with respect to the incidence angle. Although the central pulse and each subray are cast at the same time, they inevitably make contact with different parts of the scene, leading to a temporal offset in the returning pulses.
The waveform is the sum of these returning pulses and the maxima of this waveform are used to extract points for the output array. The output array is created with bins of size binSize_ns and a maximum length of maxFullwaveRange_ns (if not set to 0), which starts at the first return (pulseLength_ns before the hit). Subsequently, the recorded waveforms, scaled with their respective amplitudes are added into the array. As the bins are not necessarily aligned, they are cast to the next lowest bin.
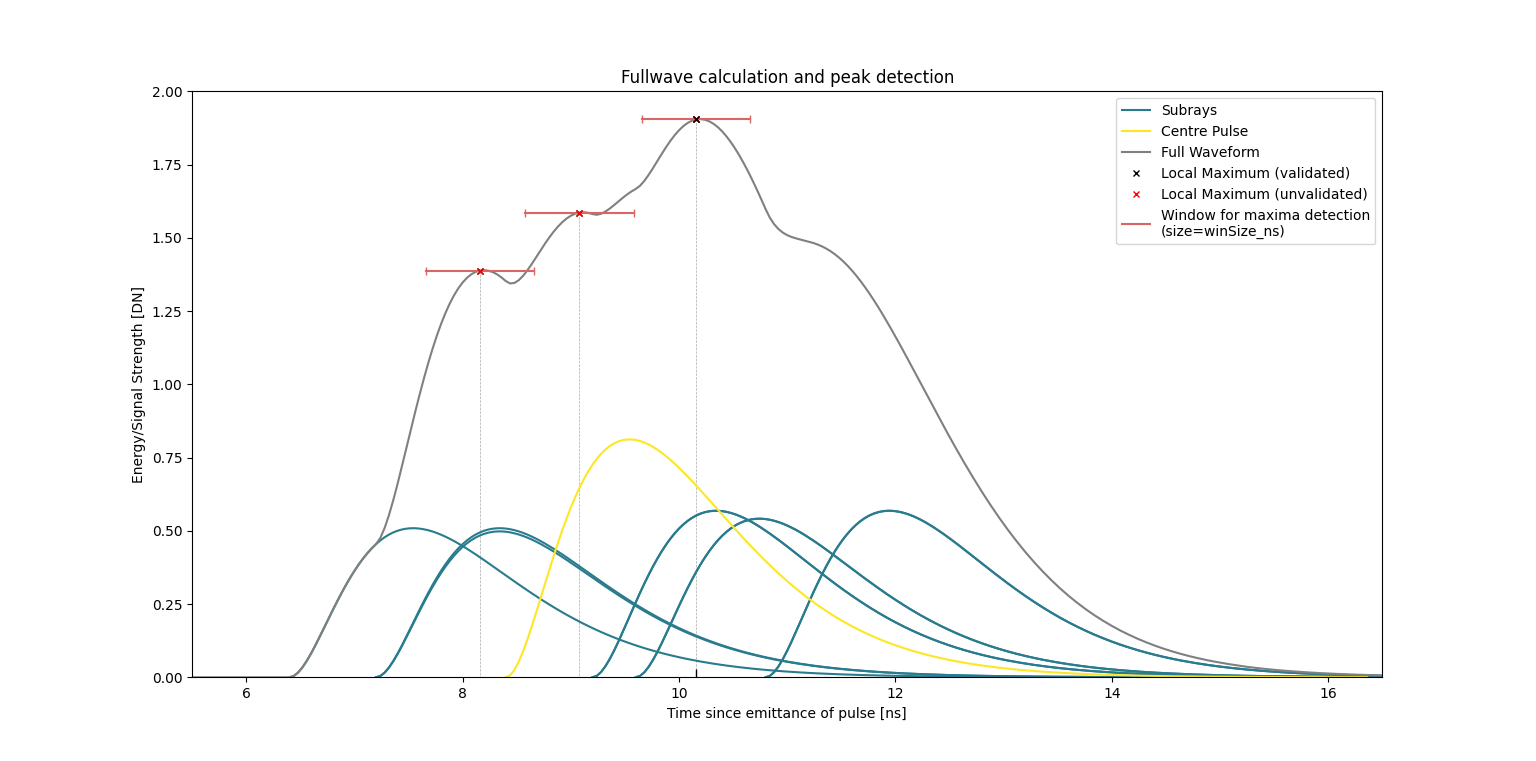
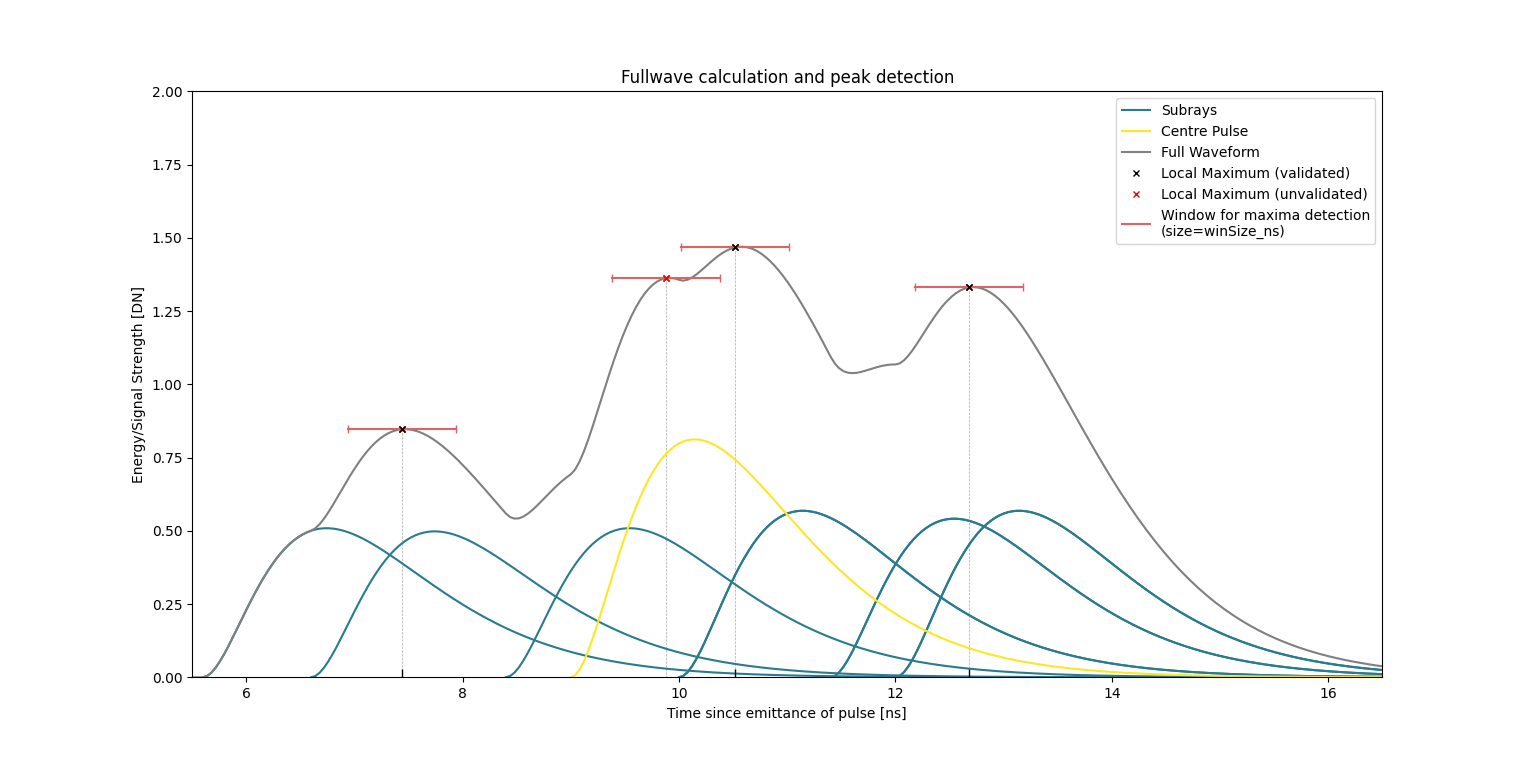
The following two graphs illustrate the calculation and analysis of one such full waveform based on the return of one laser beam with a central pulse and six subrays which, for the sake of a simplified example, is aimed at an imaginary target at roughly 3 metres distance. For the output, maxima are detected using a window approach, meaning that a maximum is counted as valid if a bin has the highest value in a neighborhood of winSize_ns. The local maxima of the waveform are indicated in the graphs, along with windows for the validation of the maxima for the final return. The examples show how using full waveform can lead to more detailed and/or precise results.

In the case of the first graph, the subrays are returned relatively close temporally to the central pulse. The resulting waveform has three local maxima, of which only one can be validated using the given window size (default=pulselength/4). In consequence, this full waveform pulse would result in this one point being added to the output array, in this case at a distance of c*10.16 ns (3.05 m) to the scanner. In comparison, the result without full waveform and evaluation of only the central pulse would have led to a less precise peak at around c*9 ns (2.7 m).

In the case of the second graph, the subrays are further spaced around the central pulse. This leads to the development of four local maxima, with three of them being validated and included in the output array. In this example the increase in the number of points leads to an evident increase in detail as well as an increase in precision.
If the command line parameter --calcEchoWidth was provided, a Gaussian curve is fitted to the waveform. This allows the determination of an echo width as the standard deviation of this Gaussian. As shown in the following figure, the maximum of the Gaussian does not align with the maximum of the pulse shape. For the distance measurement, the position of the maximum, as detected with the window approach, is used. Note that due to the binning in the full waveform calculation, this distance may be off by a maximum of binSize_ns, which is 0.25 by default, corresponding to 7.5 cm. This offset only concerns non-first returns, though, and can be decreased by choosing a lower binSize_ns.

The point position, amplitude (as detected by the maximum search), echo width (if calculated) as well as information about the return number are written to the point output file (either LAS or ASCII). The signal strength levels of the individual bins are stored - along with the beam origin and the unit beam vector - in the fullwave output file. For details on these files, see the page on Output.
Carlsson, T., Steinvall, O. & Letalick, D. (2001): Signature simulation and signal analysis for 3-D laser radar: scientific report. Linköping: Sensor Technology, Swedish Defence Research Agency (Sensorteknik, Totalförsvarets forskningsinstitut (FOI). Online access.
Phong, B.T. (1975): Illumination for computer generated pictures. In: Communications of the ACM 18.6, pp. 311-317. DOI: 10.1145/360825.360839.